.png)
Know what's slipping before the shift ends.
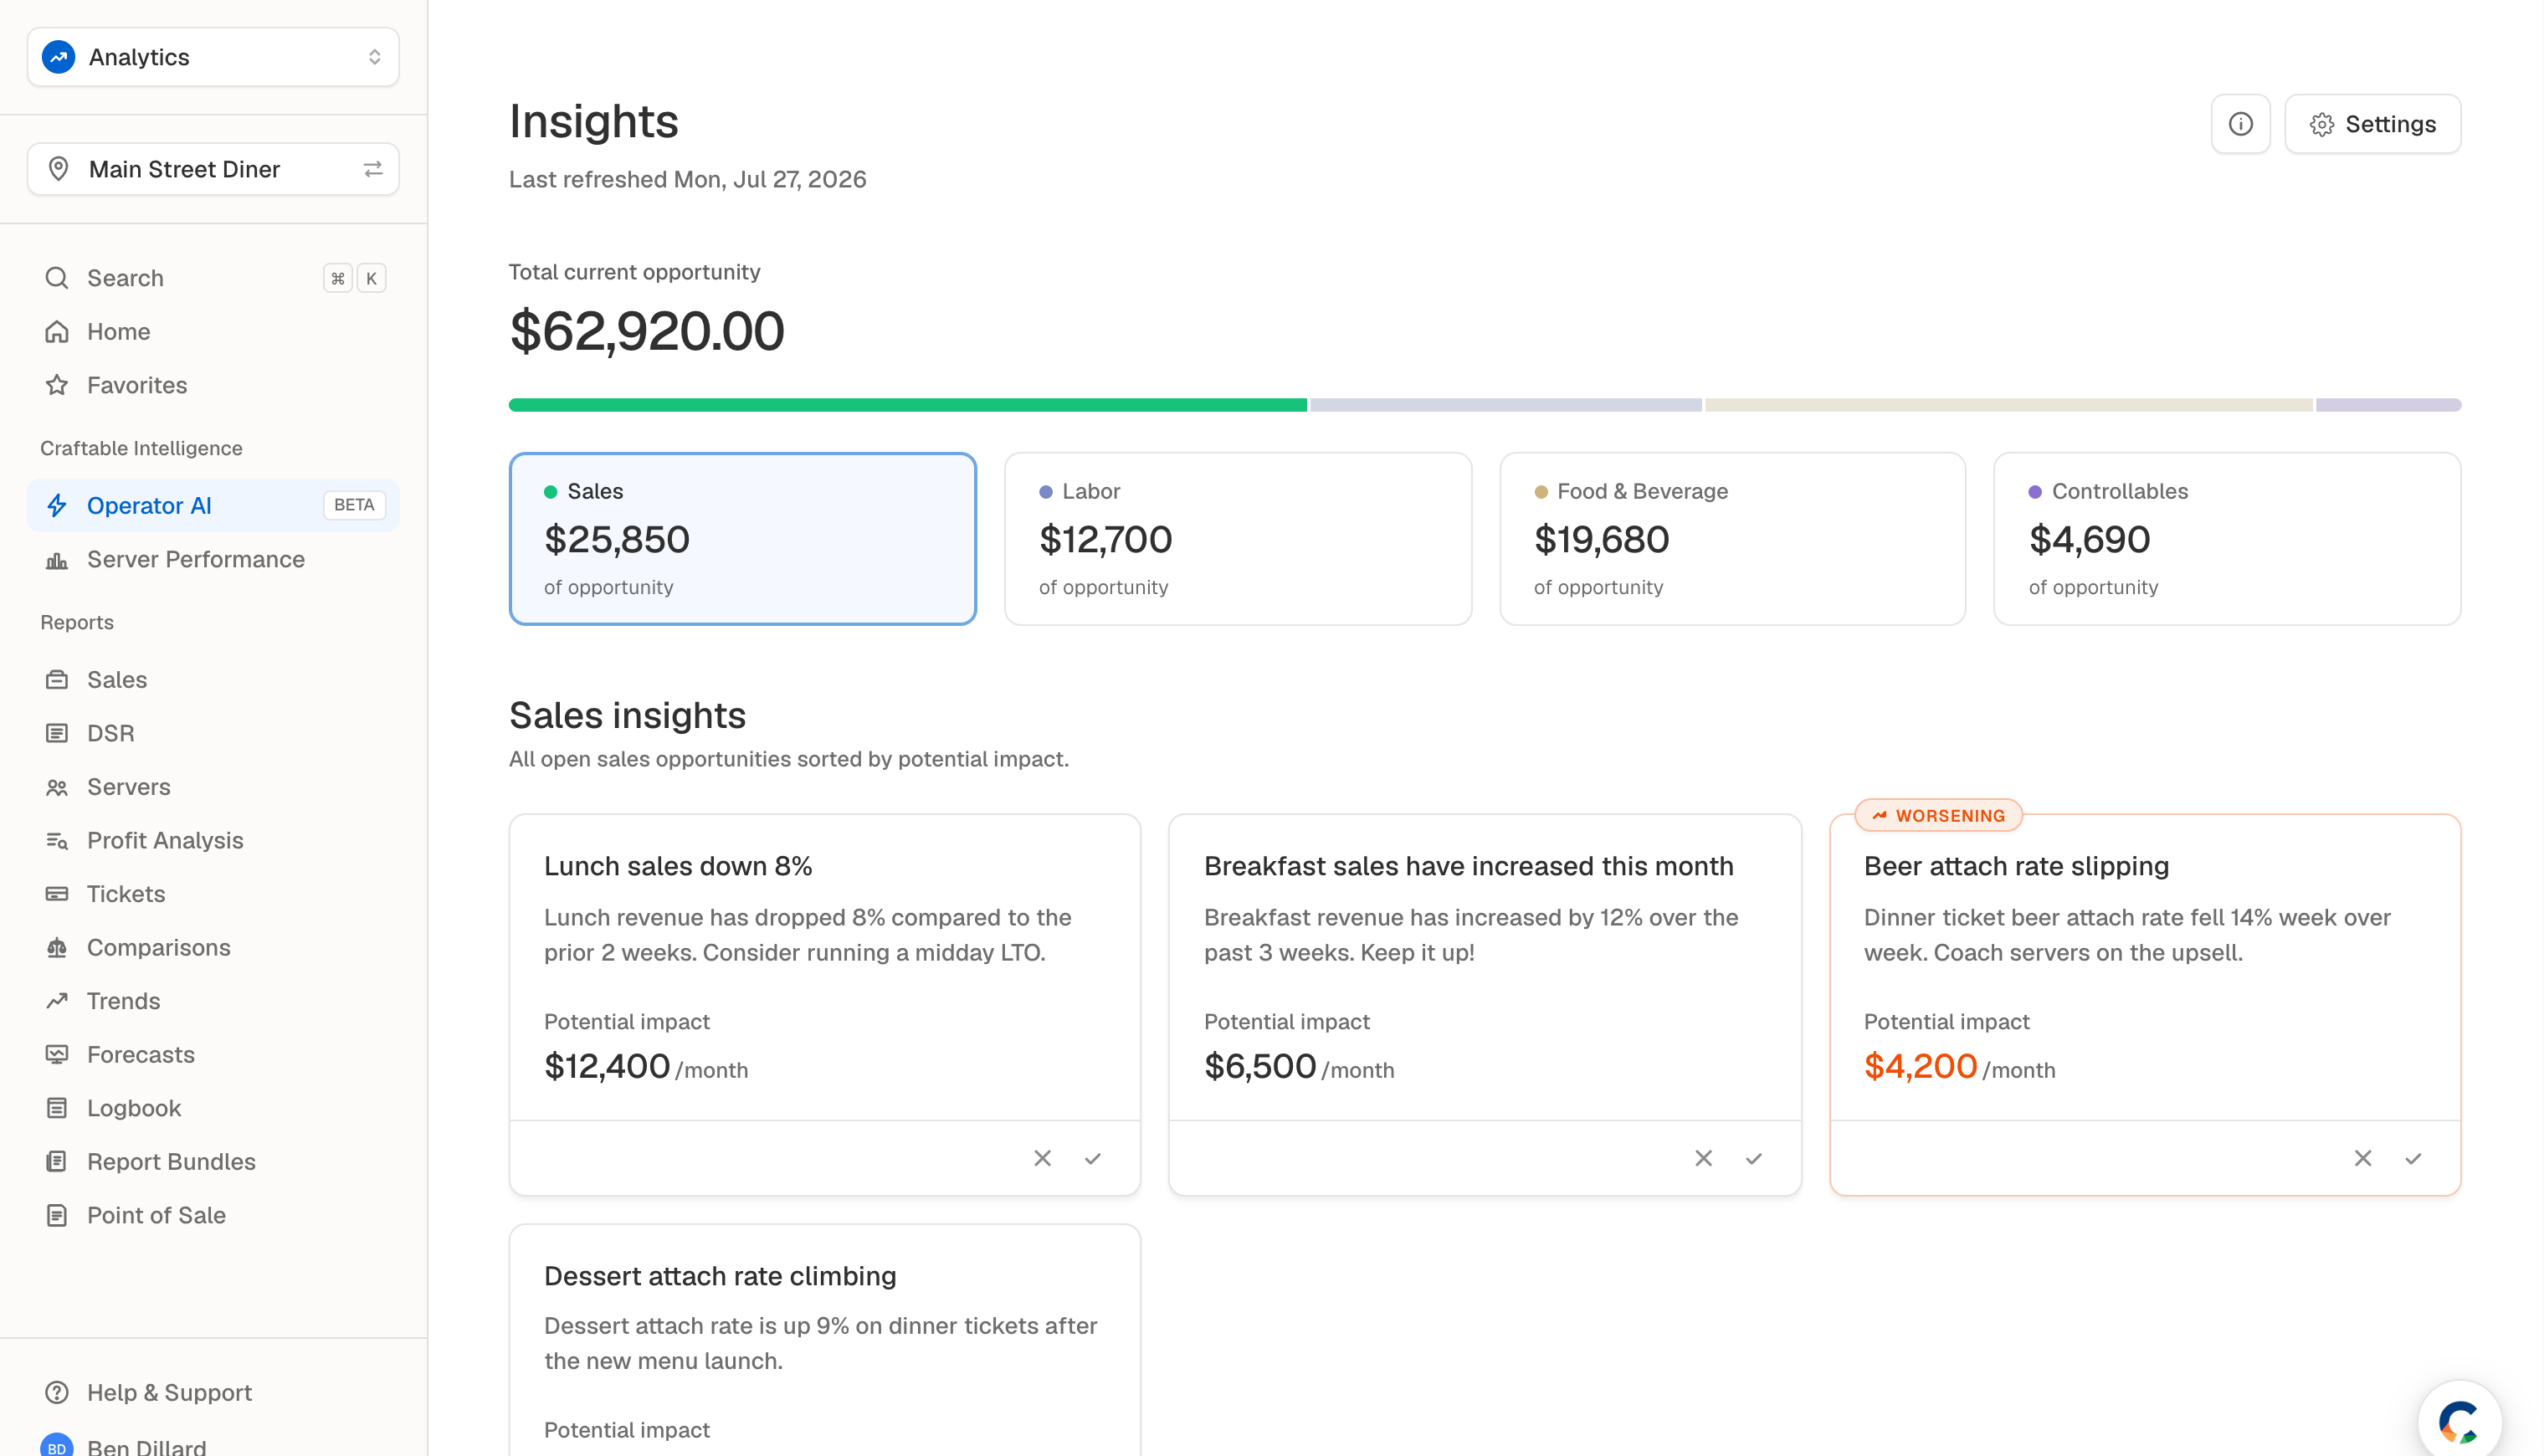
Operator AI ranks tonight's biggest revenue leaks and opportunities by dollar impact, tells your team exactly what to do, and measures whether it worked. Built on the Craftable data you already have.
Your reports tell you what already cost you money.
Dashboards show last week. Month-end reconciles the damage after it's done. Between those two, a server's void rate creeps, a vendor's price jumps, an item gets over-portioned — and the margin's gone before anyone reads a report.
You find out after the money's gone.
The leak runs all month. You see it in the P&L weeks later, once it's already spent.
- 01 Shift happens
- 02 Data lands in a dashboard
- 03 Month-end reconciliation
- 04 You spot the leak — too late to catch it
Operator AI works before the next shift.
It ranks tonight's problems and opportunities by dollar impact and hands your team a move they can make now.
- 01 Runs nightly on your data
- 02 Ranks every leak and opportunity by dollars
- 03 Tells your team what to do
- 04 Measures whether the action worked
From your data to tonight's punch list.
Runs nightly on the data you already have.
POS, labor, invoices, inventory — no new integration, no new work for your team. It's live from day one.
Ranks every opportunity and leak by dollar impact.
You get a short, prioritized list, not a wall of charts. Each card shows the number, the reason, and the suggested action.
Measures whether the action worked.
Every insight tracks views, engagement, the action taken, and the revenue recovered — so you can see what actually moved the number.
Rank every server. Coach the gap.
Operator AI scores every server against your own floor — net sales, check average, attach rates, table turns, voids — and ranks the revenue each one is leaving on the table. No guessing who to work with next.
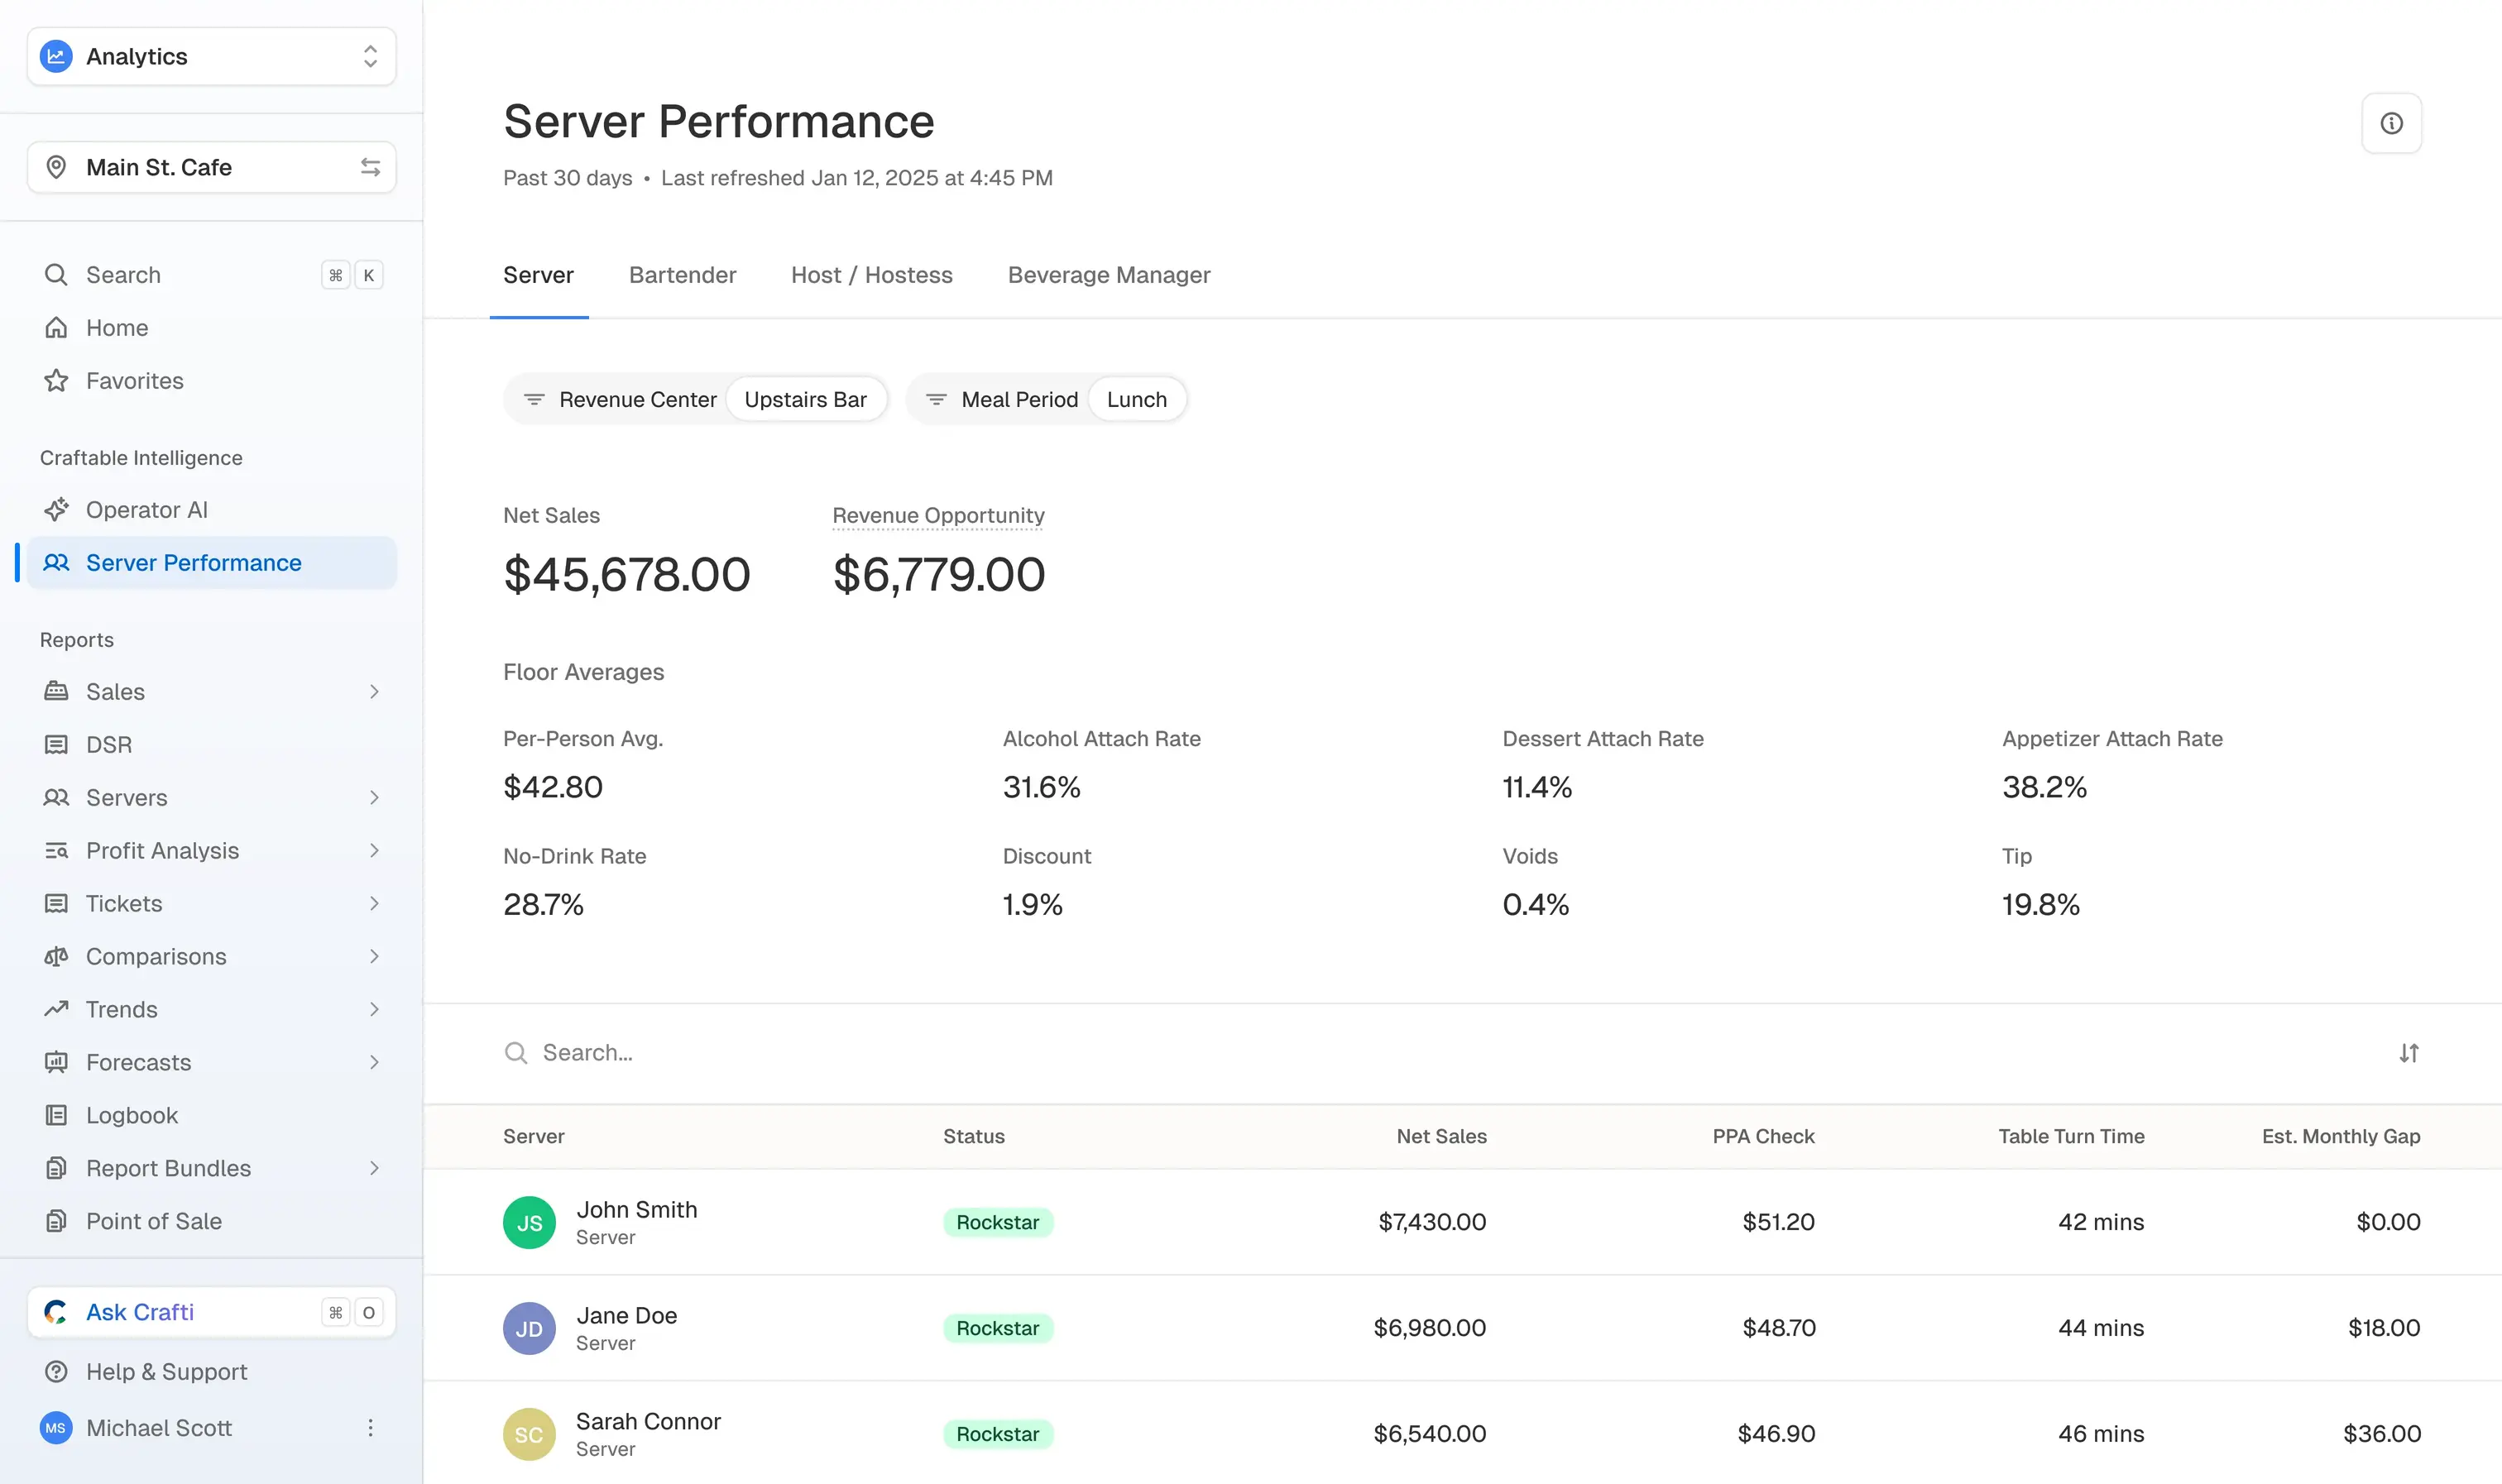
Net sales, per-check average, table turns, and the monthly gap — side by side for the whole floor, ranked by where the money is.
One card. One number. One move.
Open any server and Operator AI lays out the full scorecard — net sales, check average, attach rates, and tip, each measured against your own floor — then flags the one habit worth coaching. This is Jane: an 88 with the store's highest alcohol attach, and a dessert attach rate running below the floor she can close.
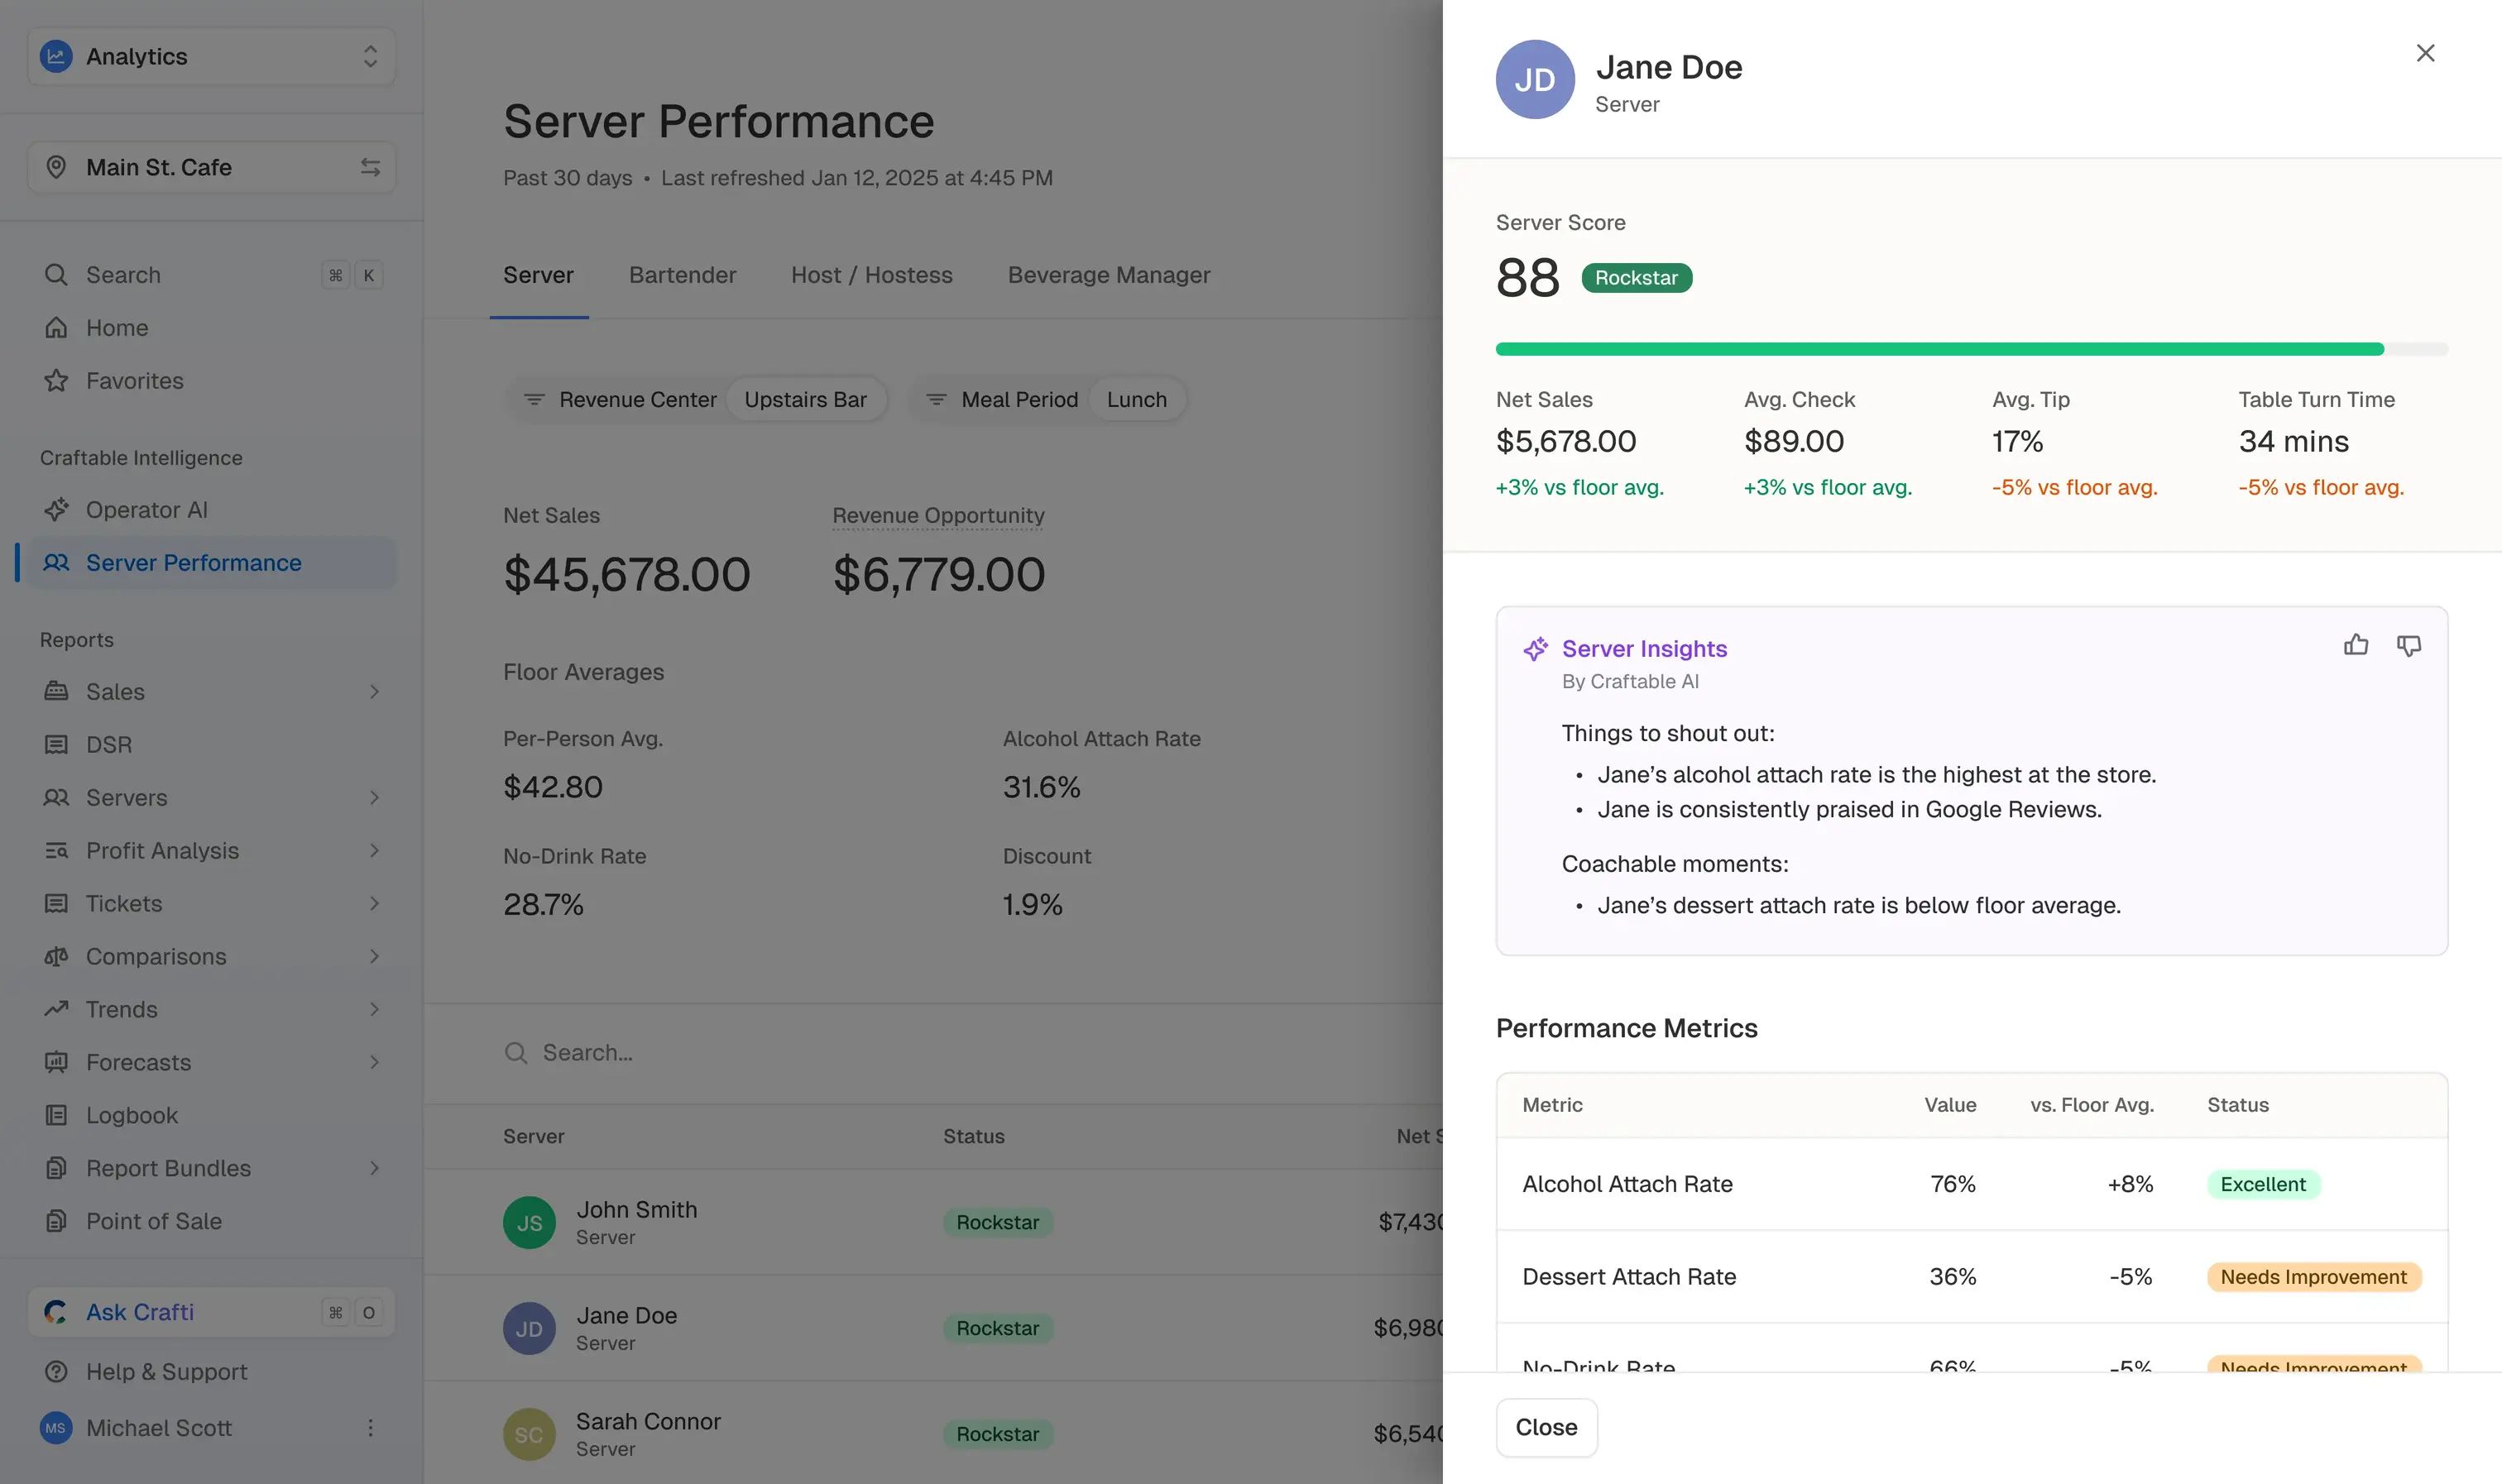
Every score is benchmarked against your own floor and paired with a move your team can make before the next shift.
The first F&B system that proves the fix paid off.
Most analytics stop at the insight. Operator AI keeps going. Like an ad platform tracks a click to a conversion, it tracks each insight from view → open → action → outcome. The week after your team acts, it checks whether the metric actually moved — and if it didn't, the card comes back with a worsening badge. You stop guessing whether the fix worked. You see it.
- GMs watch the list get shorter.
- Area managers see which stores are acting.
- F&B directors and CFOs get a closed-loop record of ROI — a measurement view that rolls dollars identified, actions taken, and revenue attributed into one screen.
Beer attach rate · closed-loop tracking
Sample data. Outcome is measured the week after the action, against the store's own pre-action floor — never against other brands or industry averages.
See the closed loop on your own numbers.
Book a demo and we'll walk your data — leaks, opportunities, and what a recovered fix looks like.
Book a demoEight ways it finds money you're leaving on the table.
Underperforming servers & shifts
Who's slipping versus your own floor average.
$10,000+per server, per yearOpportunities worth doubling down on
Positive trends to reinforce while they're hot.
up to $4M+single item to full portfolioVendor price swings
Cost-driver shifts caught at the SKU level.
$2,000–$5,000per SKUPurchasing vs. usage waste
Buying more than your recipes actually use.
$5,000–$20,000per itemCost leaks
Discount and comp anomalies that add up.
up to $66,000per yearInventory shrink
Shrinkage tracked item by item.
$1,000–$4,000per itemVoid spikes
Void rates running above your floor.
up to $69,000per yearLabor ROI & overtime drag
Where labor spend isn't returning.
up to $91,000per yearAcross the April 2026 pilot, Operator AI surfaced over 5,000 quantified insights — 31 insight categories running nightly against real operator data.
Numbers your CFO can defend.
Auditable math.
Every insight cites the data behind it. The numbers are computed deterministically — the AI ranks and prioritizes, it doesn't invent them.
Benchmarked against your own floor.
Every comparison is within a single store, against that store's own daypart and revenue-center averages. Never against other brands. Never industry data. Your numbers stay yours.
Your data stays isolated.
Insights are stored per store, isolated by tenant. Your data is never used to train models for anyone else.
Every store. Every outlet. Every night.
Whether you run 12 restaurants or a hotel with 6 outlets, Operator AI treats each location as its own store — ranking each one's insights and, with action attribution, showing you which locations are acting on them. Triage the whole portfolio from one feed.
It already knows your business.
Operator AI isn't a bolt-on that needs a data project to start. It runs on the POS, labor, invoice, and inventory data already flowing through Craftable — the only platform built for the full hospitality back office. That's a wider data surface than a standalone analytics tool will ever see, live from day one.
Explore the full Craftable Intelligence suite · Ask questions of the same data with Crafti
One data surface, feeding Operator AI
We'd have a gut feeling something was down. But proving it took a deep dive — pulling the query, building the data, making it digestible. Now we spend more time talking about what to do, rather than proving the problem exists first.— Director of Beverage, multi-unit restaurant group · Operator AI pilot
The back office behind operators at scale.
Trusted by operators including bartaco, Hôtel Swexan, TC Restaurant Group, Woods Coffee, and José Andrés Group.
What operators ask before they buy.
Does it make up numbers?
Do I need a new integration?
What data does it use?
How are benchmarks calculated?
Is my data used to train models?
How often does it update?
Do I need a data analyst to use it?
See what Operator AI finds in your numbers.
Book a demo and we'll walk your data. It takes about 20 minutes.