actionabkle
DAILY ACTIONABLE INSIGHTS

Know what's happening before it becomes a problem.

Most hospitality operators are managing with yesterday's numbers — and by the time the report runs, the damage is already done. Craftable connects purchasing, sales, and labor data in one live view so your team can spot issues, close variances, and make decisions in real time.

Book a Demo

TC Restaurant Group: 30 labor hours saved monthly. 80% variance reduction.

The data exists. The problem is it's scattered across five systems and nobody's looking at it in real time.

10%

Up to 10% of Purchase Value is Lost to Waste

NRA State of the Restaurant Industry 2025 Report

12

Typical # Items Driving Highest Costs for Craftable Customers

Craftable Customer Experience

80%

Variance reduction after implementing Craftable

TC Restaurant Group

When purchasing, sales, and labor live in separate systems, the gaps between them become blind spots. Craftable closes those gaps — giving every role on your team the exact view they need, updated in real time.

Reporting & BI Web 2
Real-Time Reporting

See it.

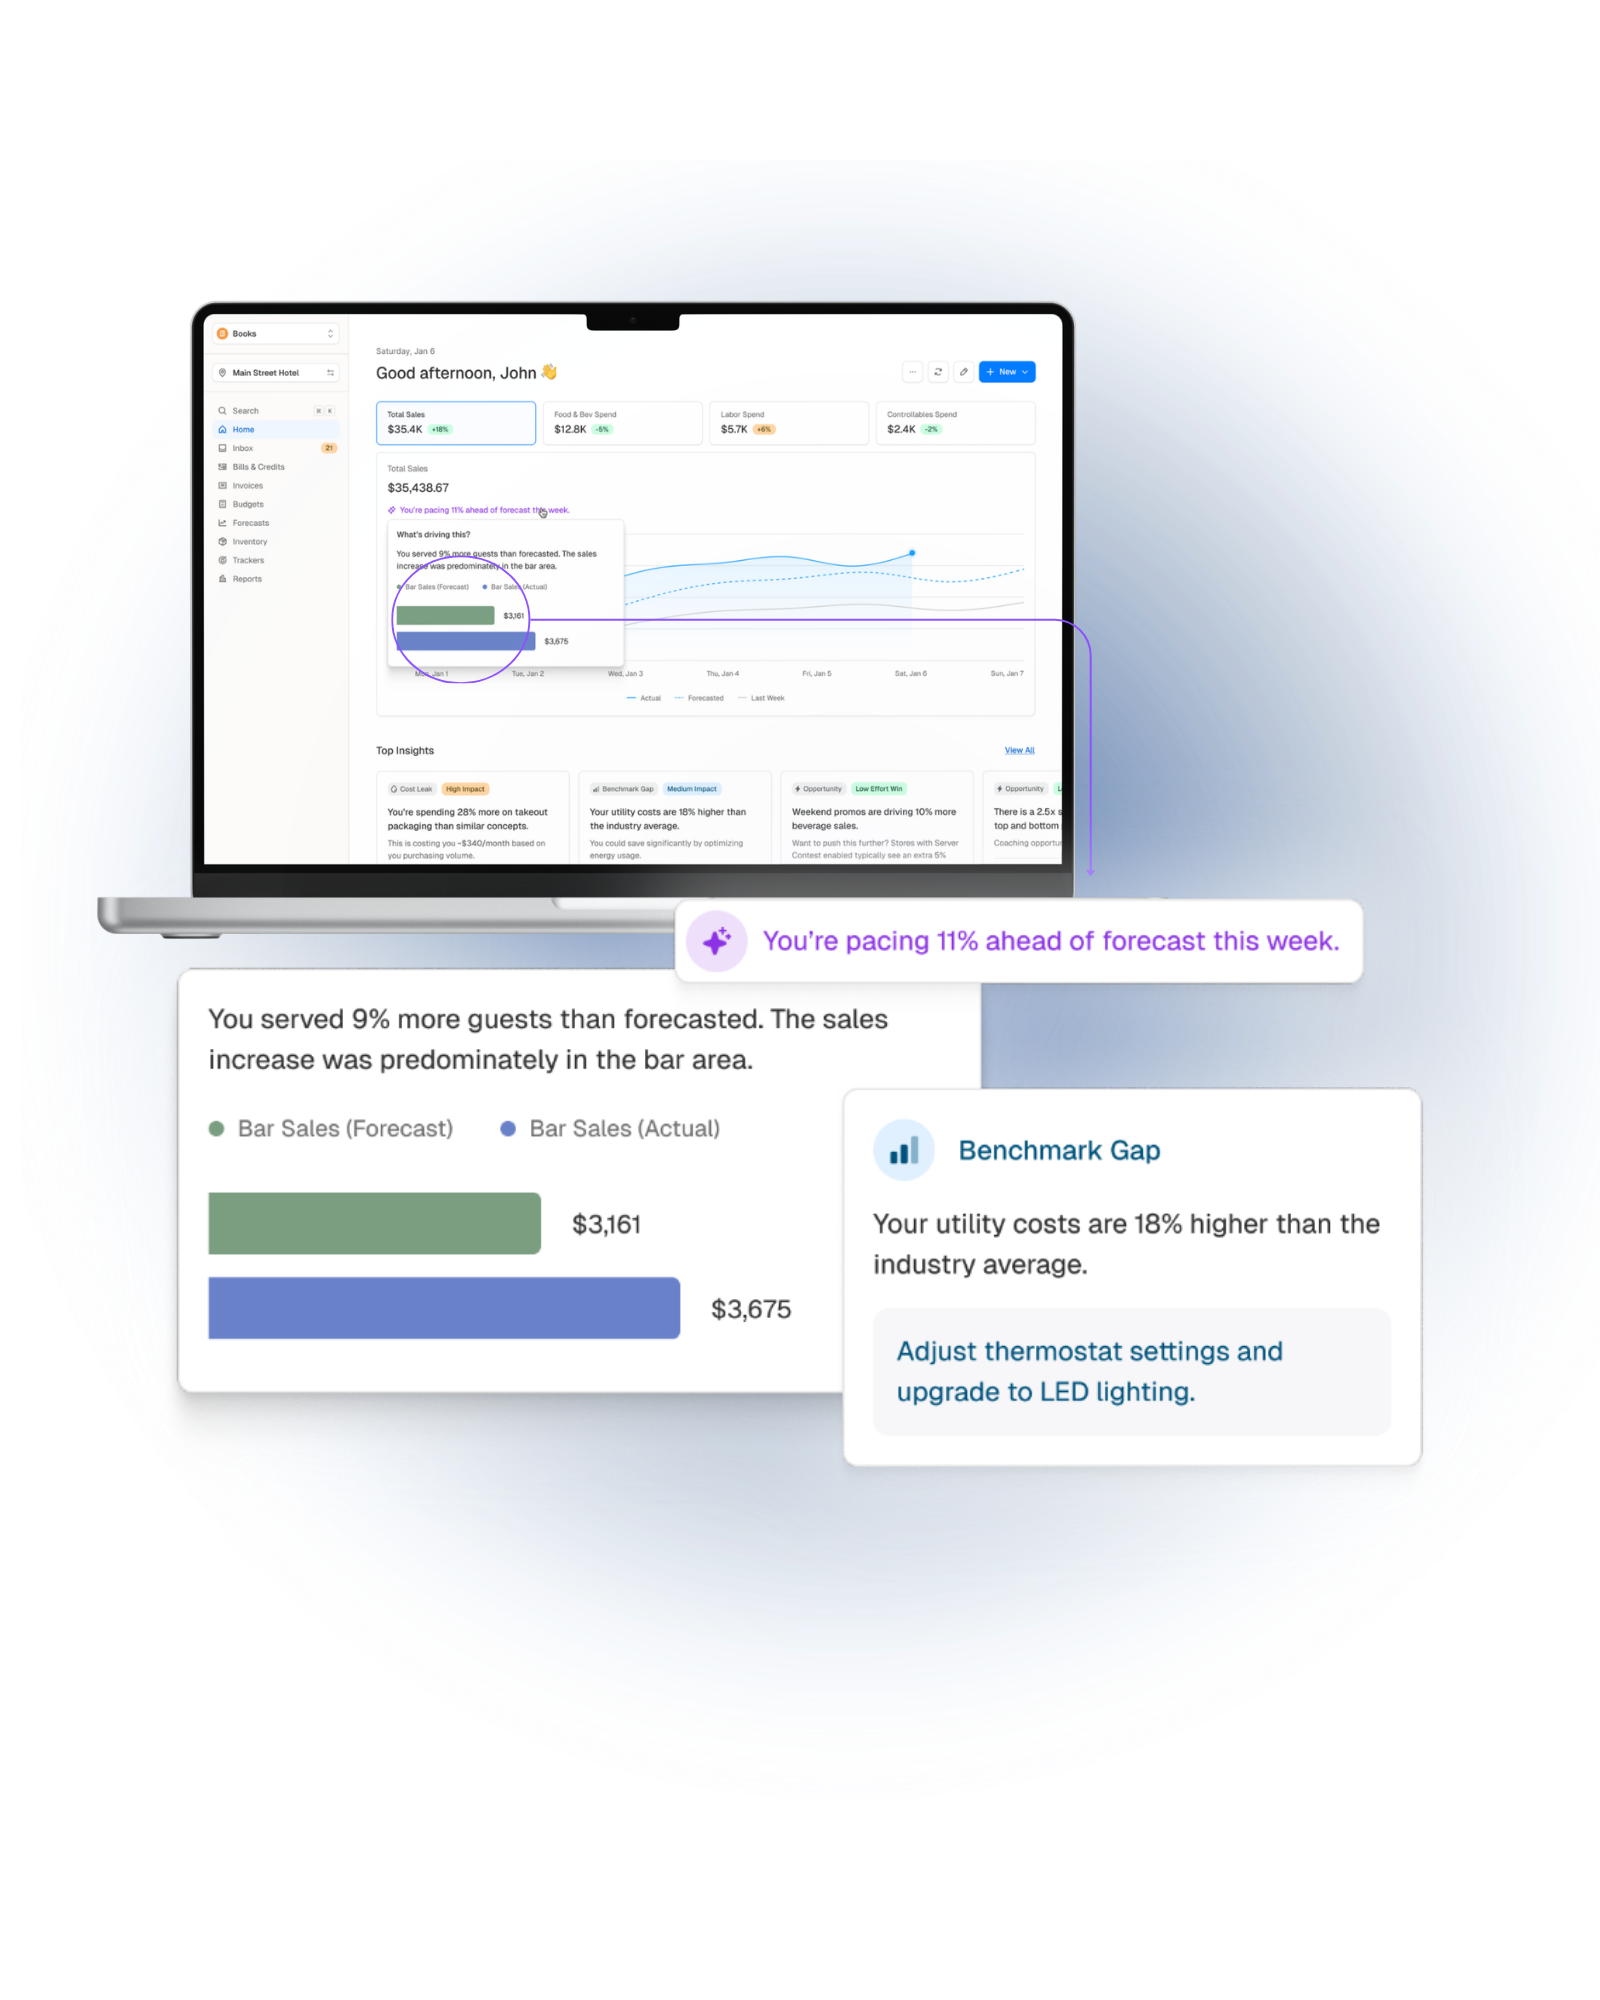
Most hospitality teams are making decisions based on data that's 24 to 48 hours old. Craftable gives you a live view of revenue, cost, and variance across every location — so you're always working from what's actually happening, not what happened yesterday.

  • Track live revenue and expenses by location
  • Compare actual vs. theoretical COGS as the day unfolds
  • Break down variances by department, daypart, or period
  • Keep reporting consistent across every role and device
Detect Cost Gaps Web 2
COST INTELLIGENCE

Own it.

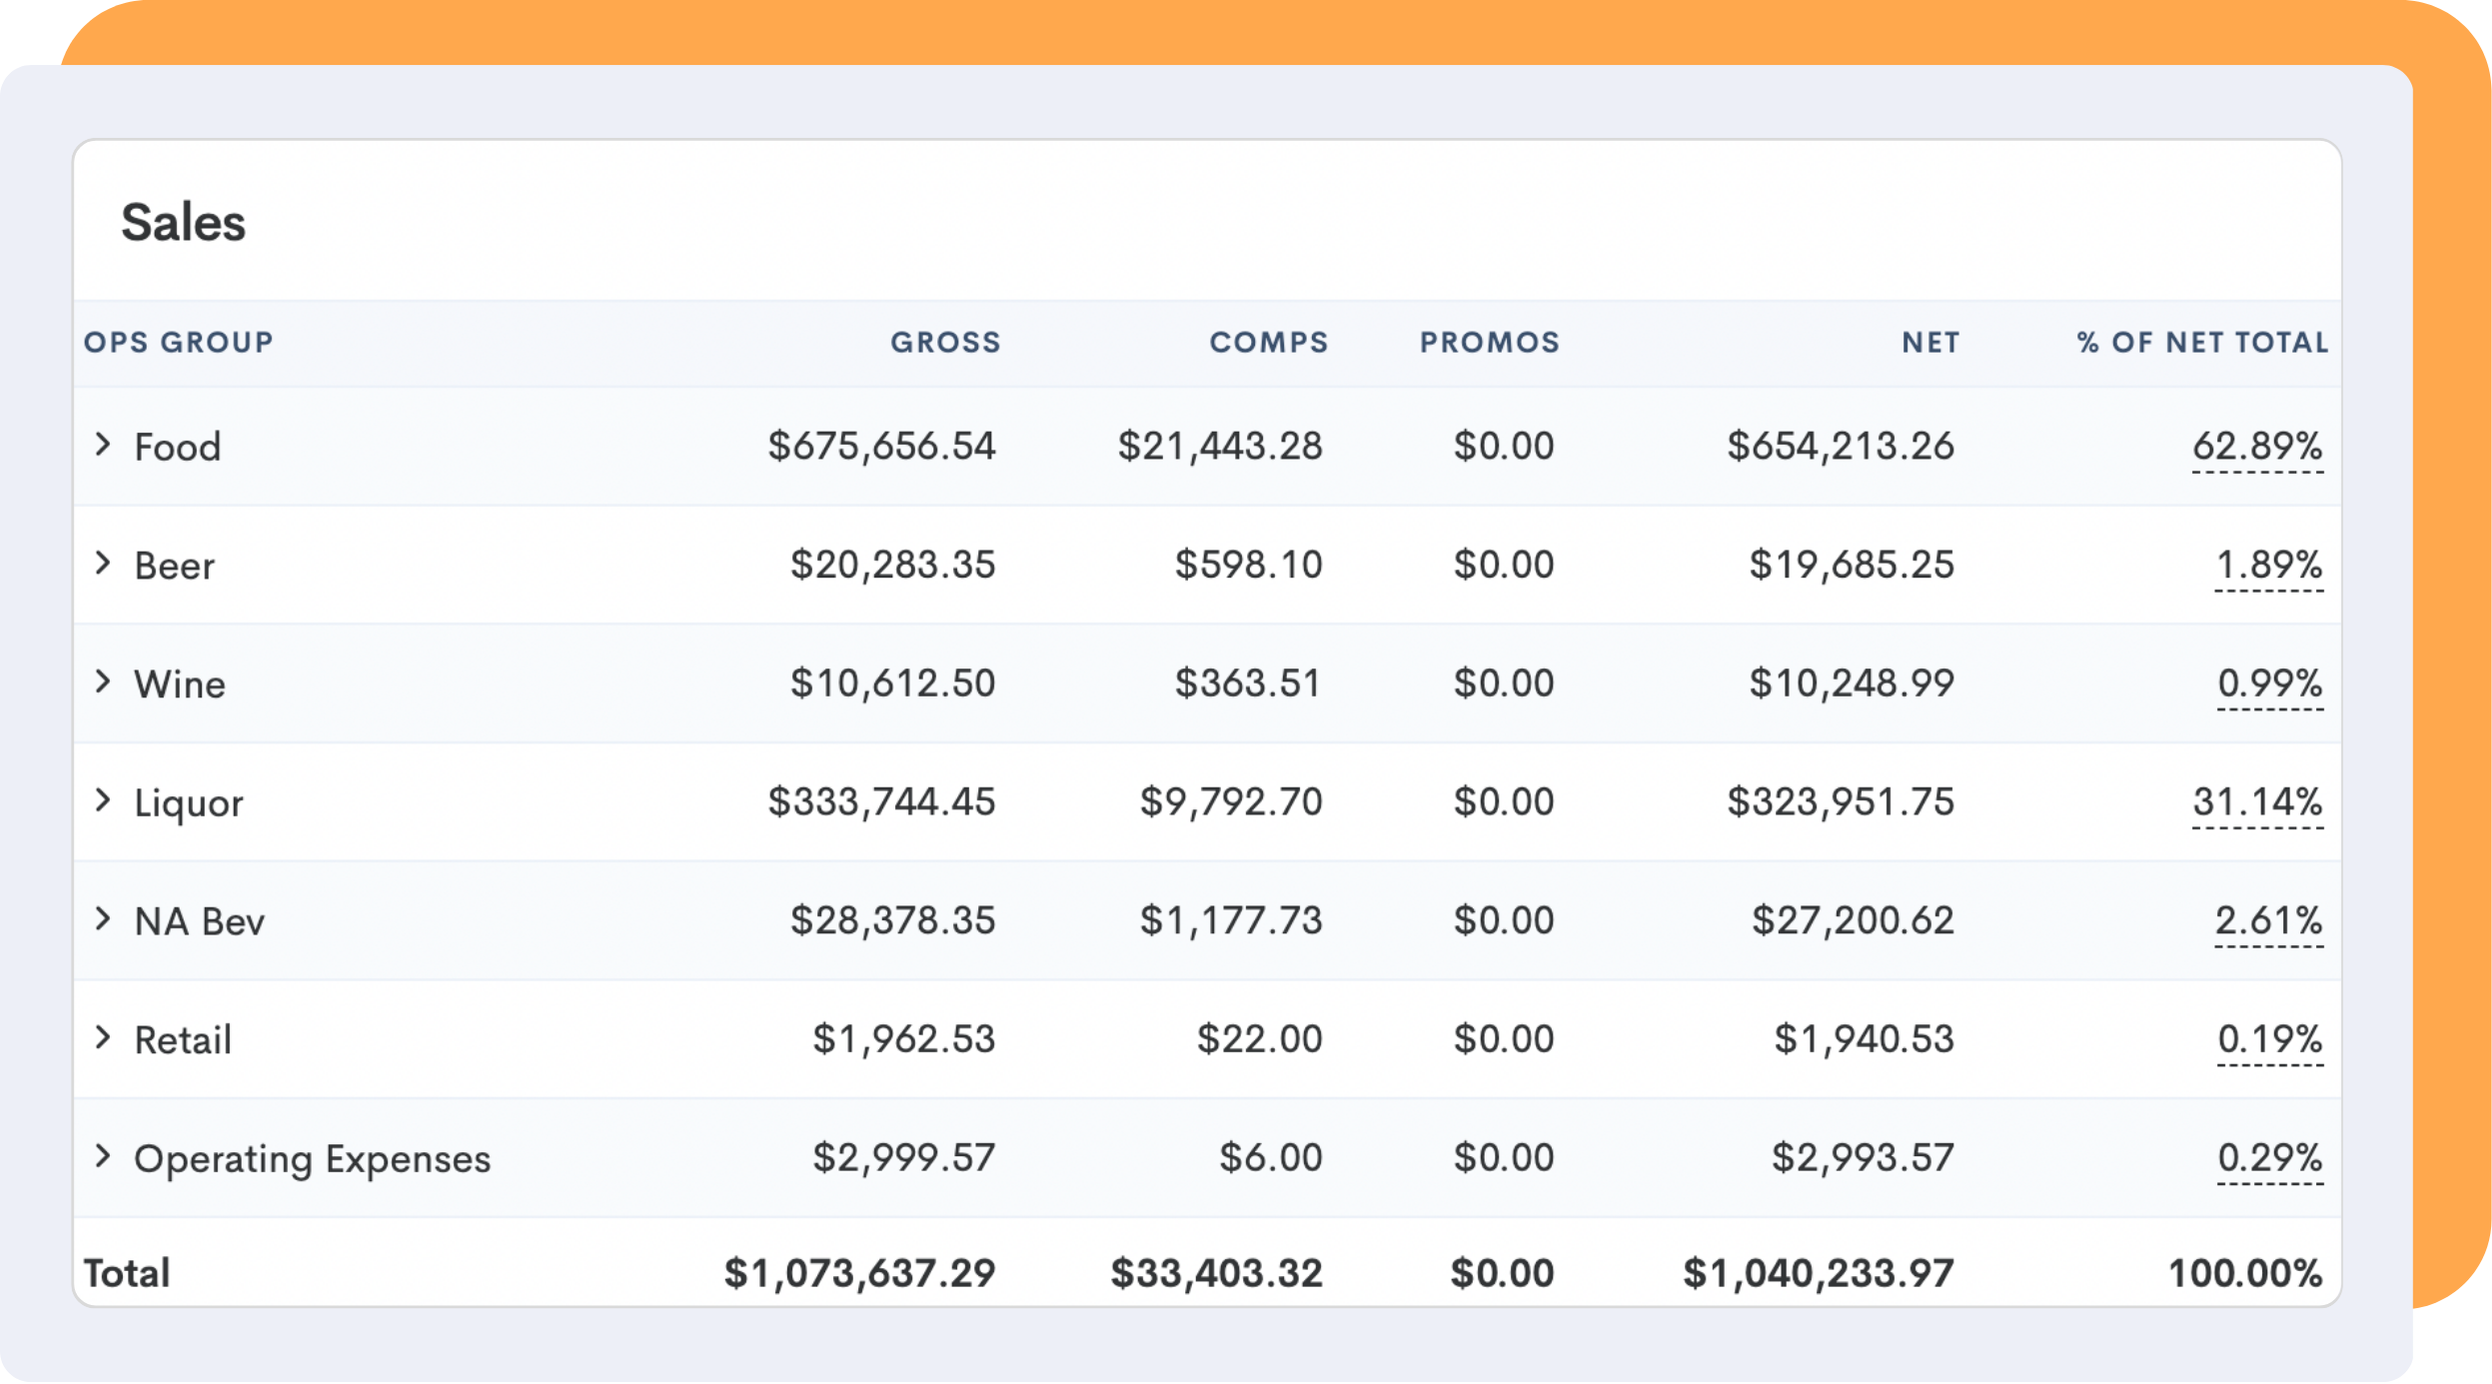
A high food cost number tells you there's a problem. Craftable tells you which 12 items are causing it. Connect purchasing to sales and menu data to catch mismatched orders, supplier price gaps, and inventory issues before they compound into something bigger.

  • Compare purchase spend to sales mix to spot mismatches
  • Flag slow-moving or excess stock automatically
  • Link ingredients to menu items to see true profitability
  • Catch pricing discrepancies with PO-to-invoice matching
auto distro
AUTOMATED DISTRIBUTION

Act on it.

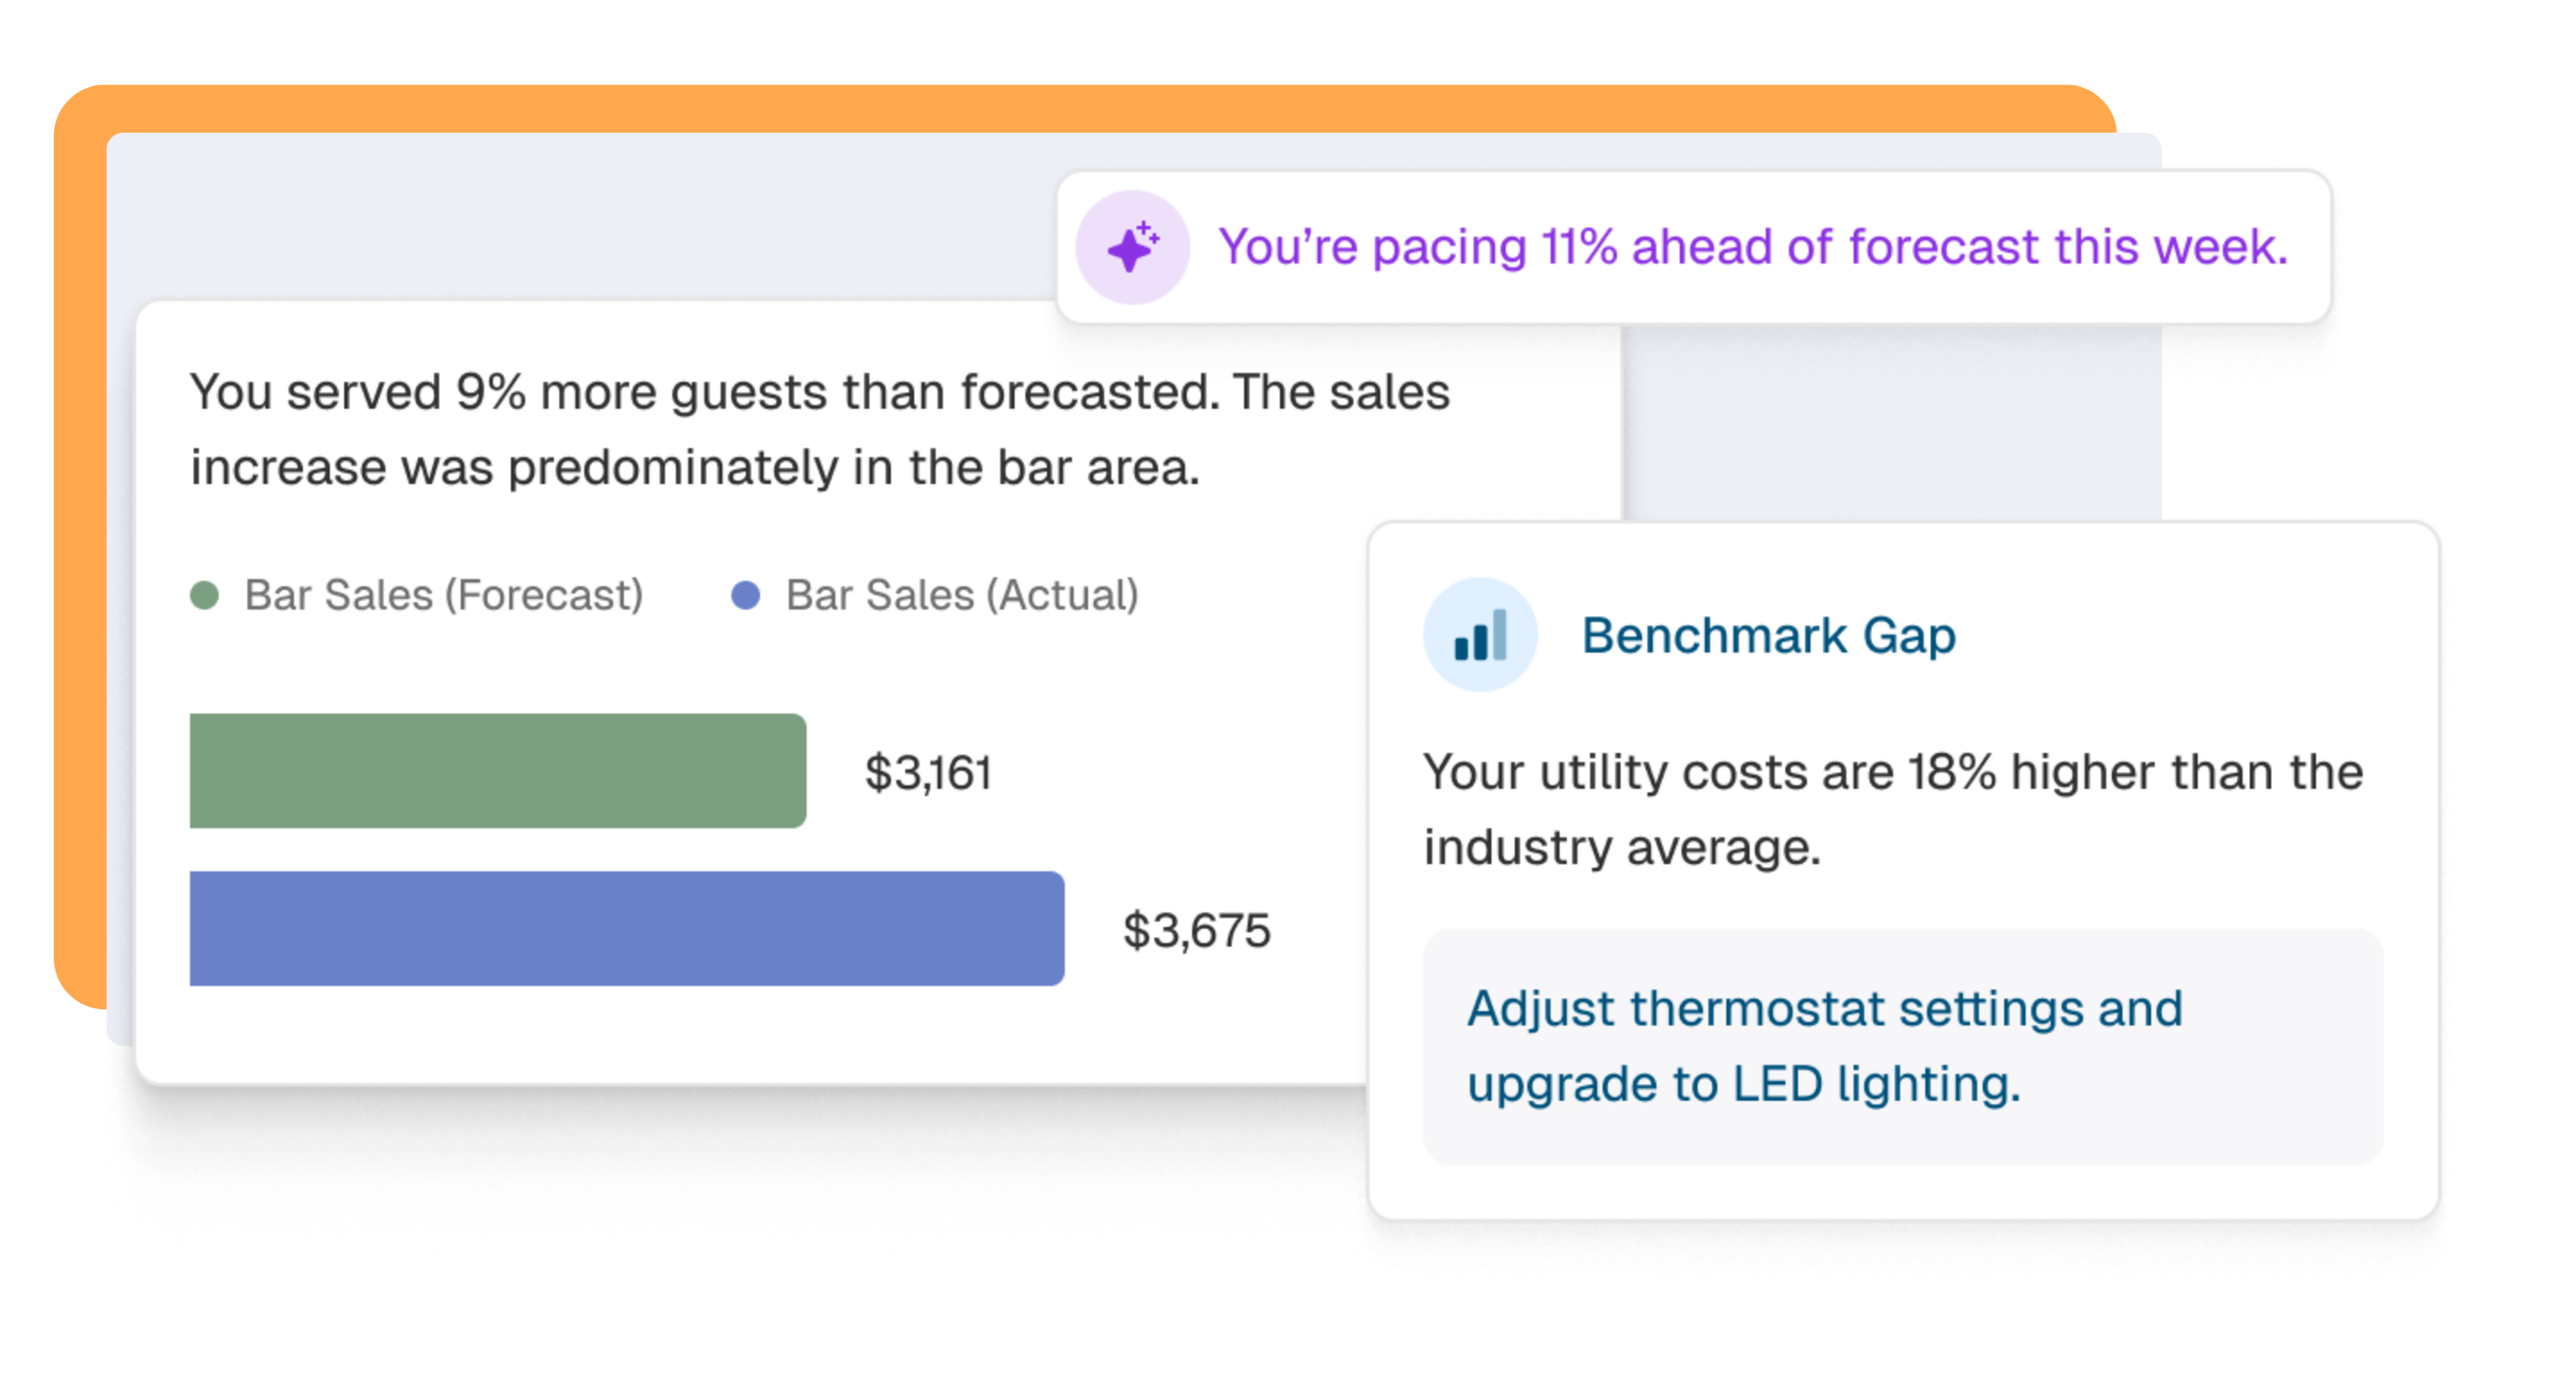
The right insight only matters if it reaches the right person at the right time. Craftable schedules and distributes role-specific reports automatically — so GMs, chefs, and ownership each see what they need, without someone manually pulling it every morning.

  • Real-time dashboards built for each role
  • Schedule reports by location, metric, or timeframe
  • Share audit-ready data with no manual prep
  • Sales vs. labor trending visible at a glance
tc-restaurant-group-jason-aldeans-stage-from-balcony
Case Study

“We track data such as upselling, profit by employee, and server contests, all of which motivate our teams and provide metrics by which we are able to elevate our own in-house standards.”

30

labor hours saved monthly

80%

variance reduction

Read Full Case Study
FREQUENTLY ASKED QUESTIONS

Reporting and Analytics

What kind of reporting does Craftable provide? +

Craftable provides reporting on purchasing trends, inventory usage, vendor pricing, invoice history, and operational performance across locations. Finance and operations teams can view consolidated data across properties and export reports to support budget planning and vendor negotiations.

How does operational reporting help hospitality businesses? +

Operational reporting allows leadership teams to monitor cost drivers, identify spending patterns, and spot issues before they affect the bottom line. When purchasing, inventory, and invoice data are connected in one report, teams can act on real information instead of end-of-month surprises.

Can operators track performance across locations? +

Yes. Craftable's multi-location reporting allows hospitality groups to compare purchasing trends, inventory usage, and financial performance across stores or properties — helping leadership identify where costs are in line and where they need attention.

BOOK A DEMO

See exactly where your margins are leaking — in 30 minutes.

In 30 minutes, we'll show you how operators like yours are cutting food costs, eliminating manual AP work, and getting real-time visibility into their margins.

No generic demo. We'll show you your concepts, your numbers, your use case.

★★★★★  "We saved $500K in one year." — Jim's Steakout