One Source of Truth
Reporting & Business Intelligence
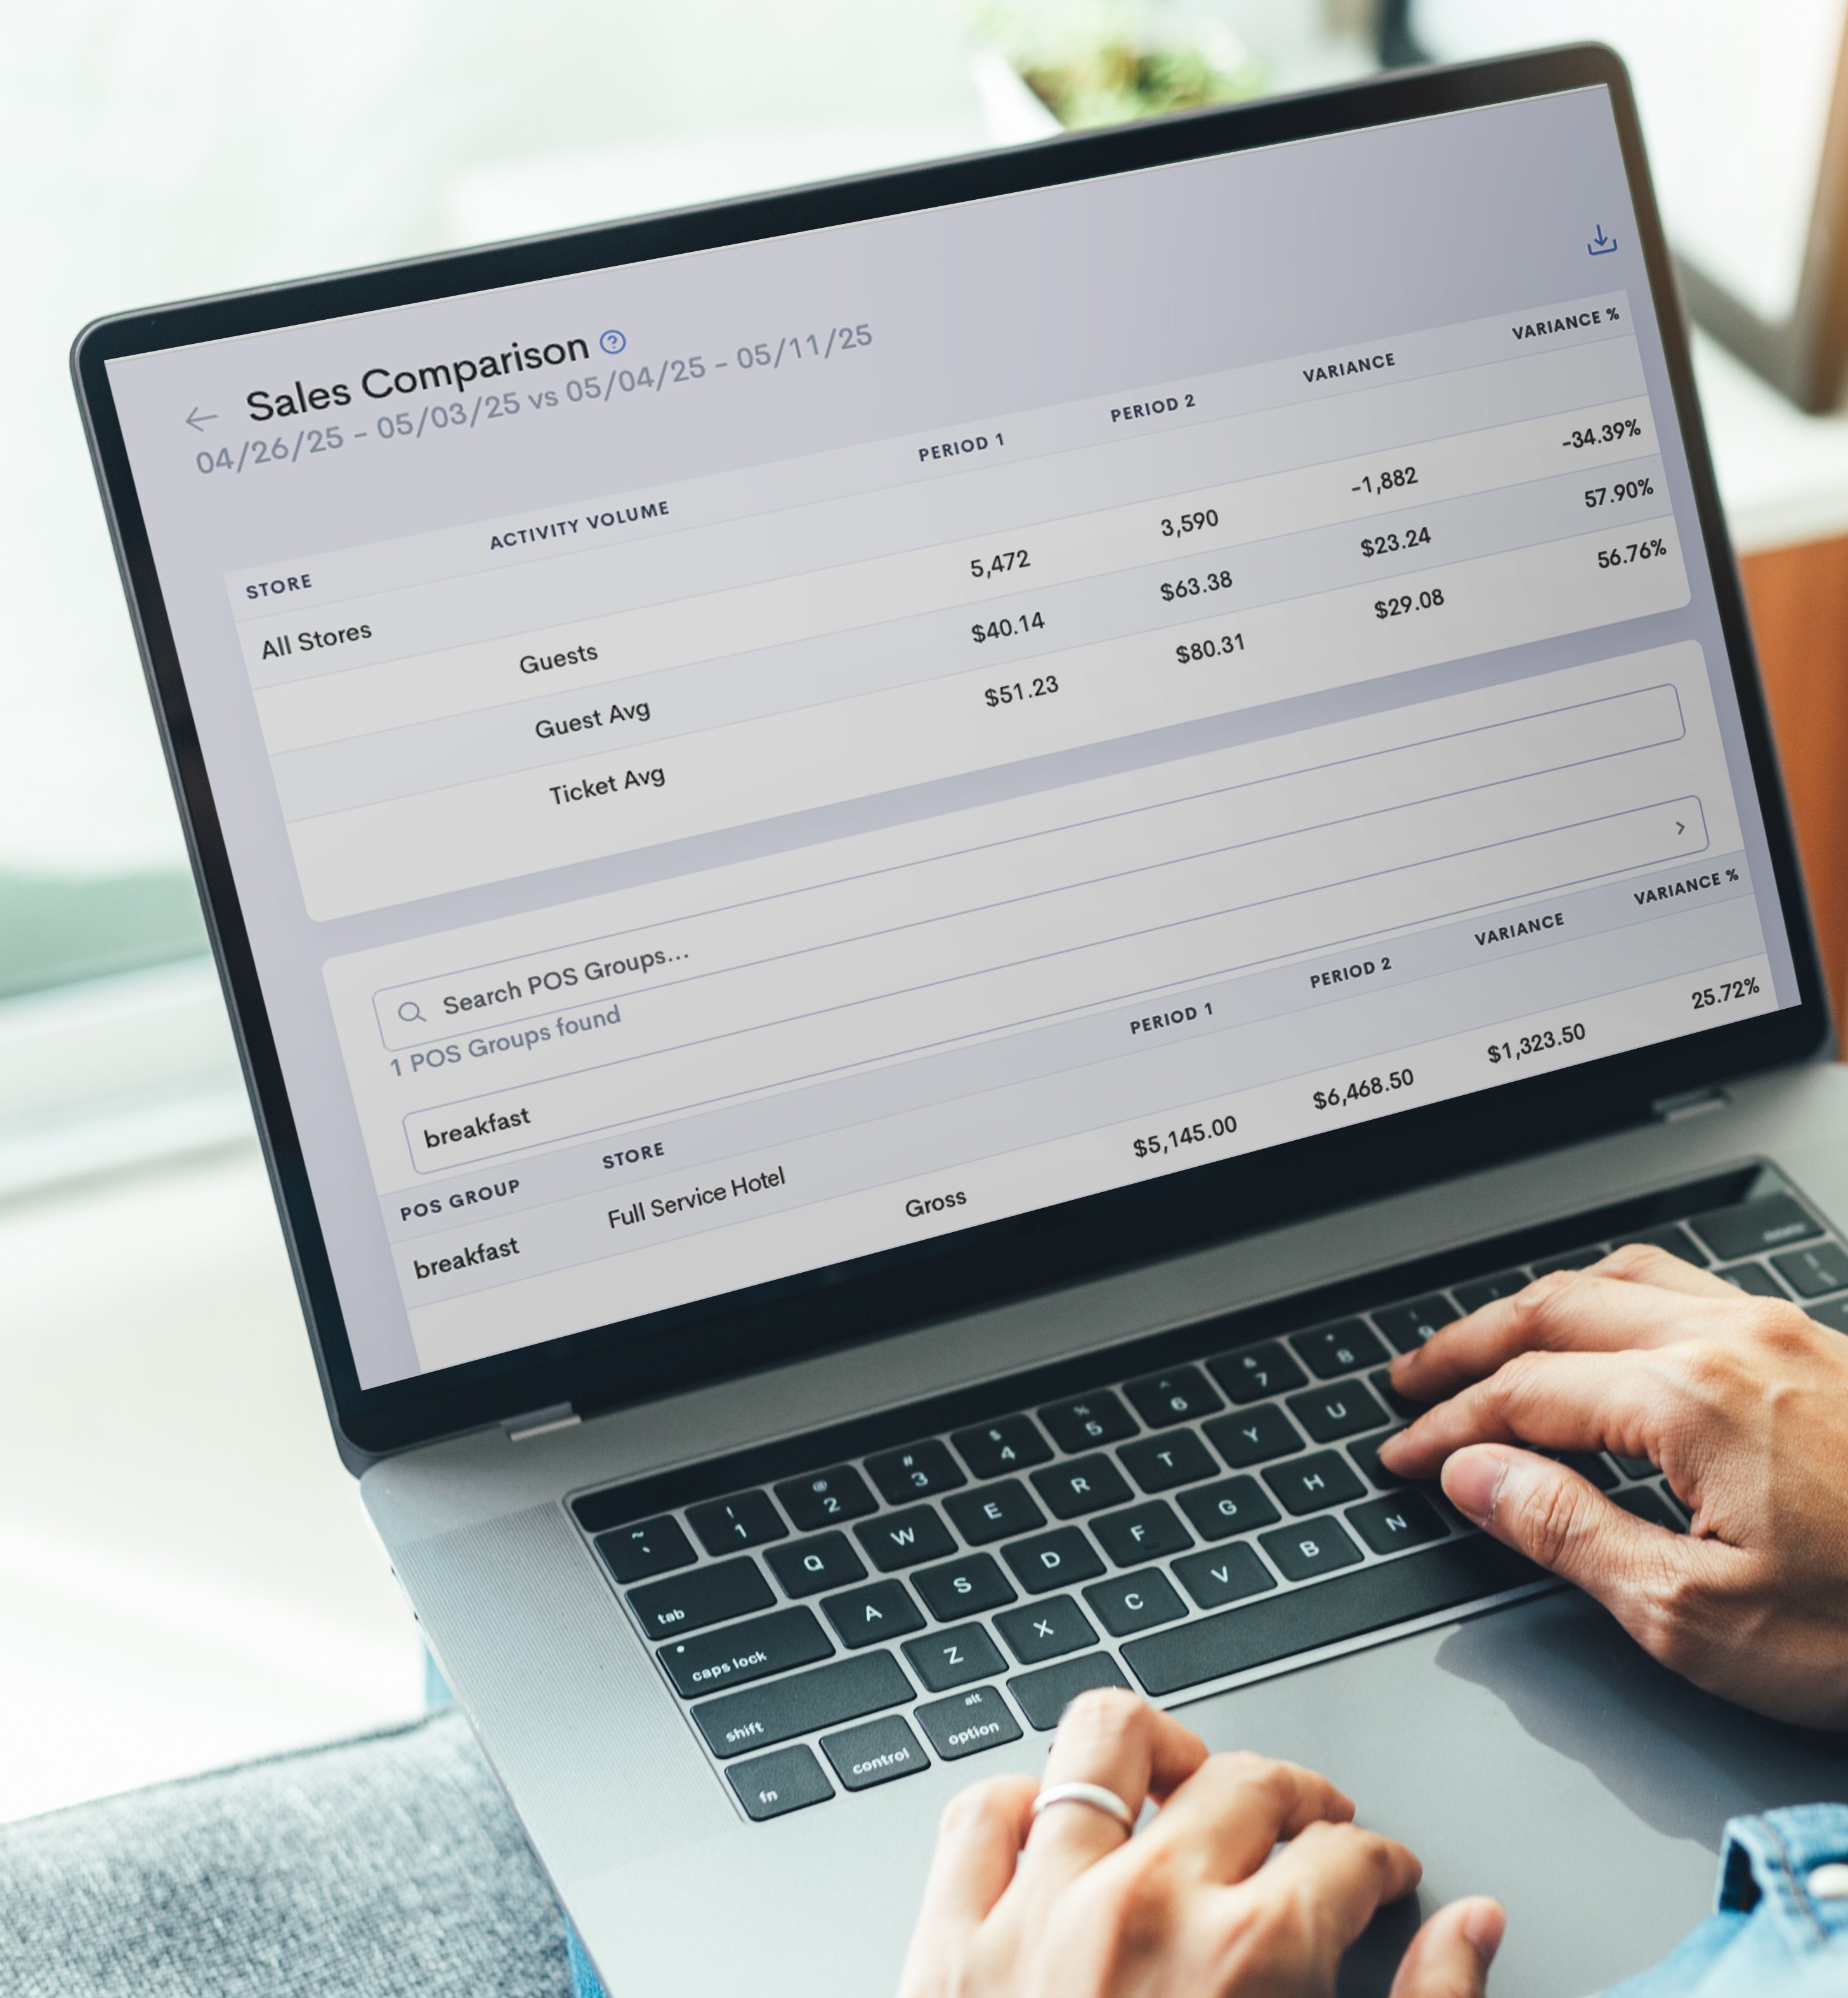
Your hospitality teams make better decisions when finance and operations share a unified view.
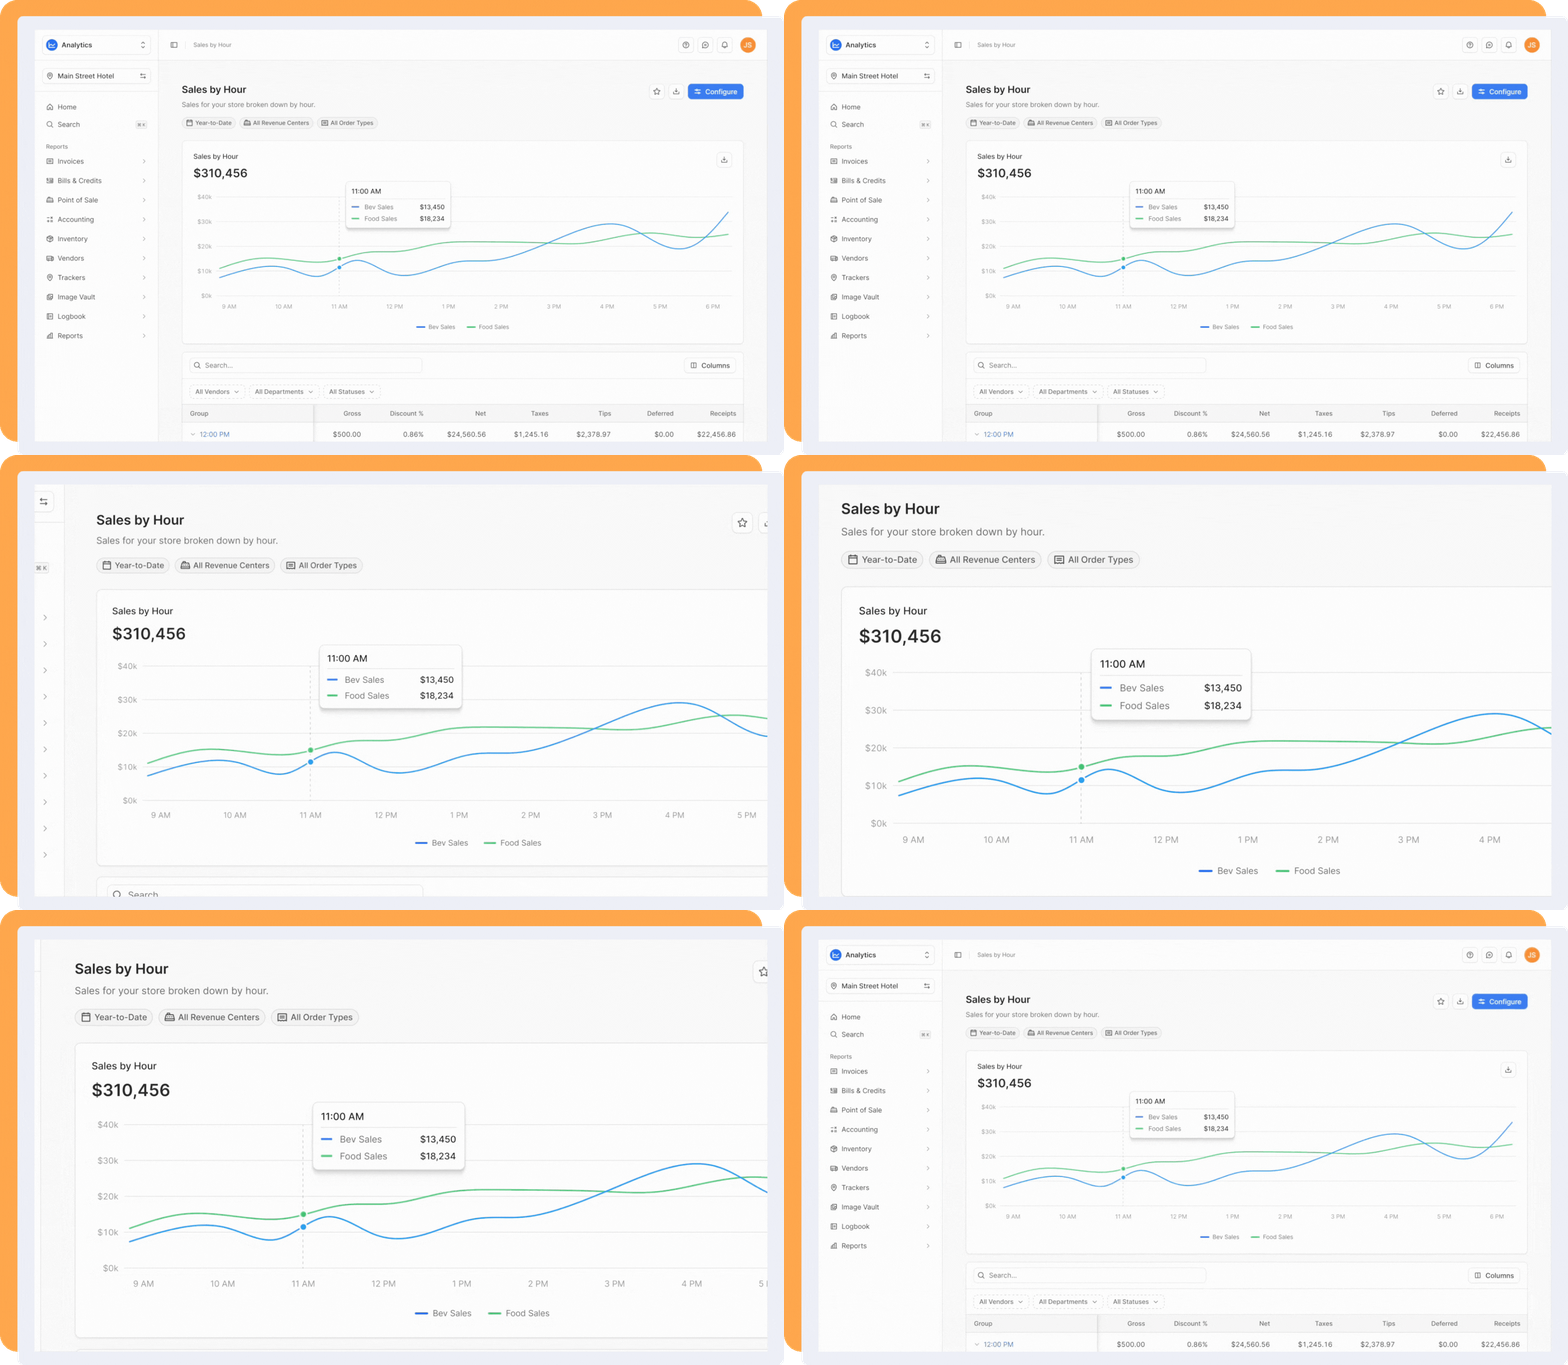
Bring together purchasing, sales, and performance metrics in real-time, grounding you in the data that matters most.
Smarter moves for stronger margins
-15%
RevPAR Budget vs. Actuals
Actabl H1 Data Report ($127 vs. $108)
10%
Up to 10% of Purchase Value is Lost to Waste
NRA State of the Restaurant Industry 2025 Report
12
Typical # Items Driving Highest Costs for Craftable Customers
Craftable Customer Experience

Your Numbers, Up to Date
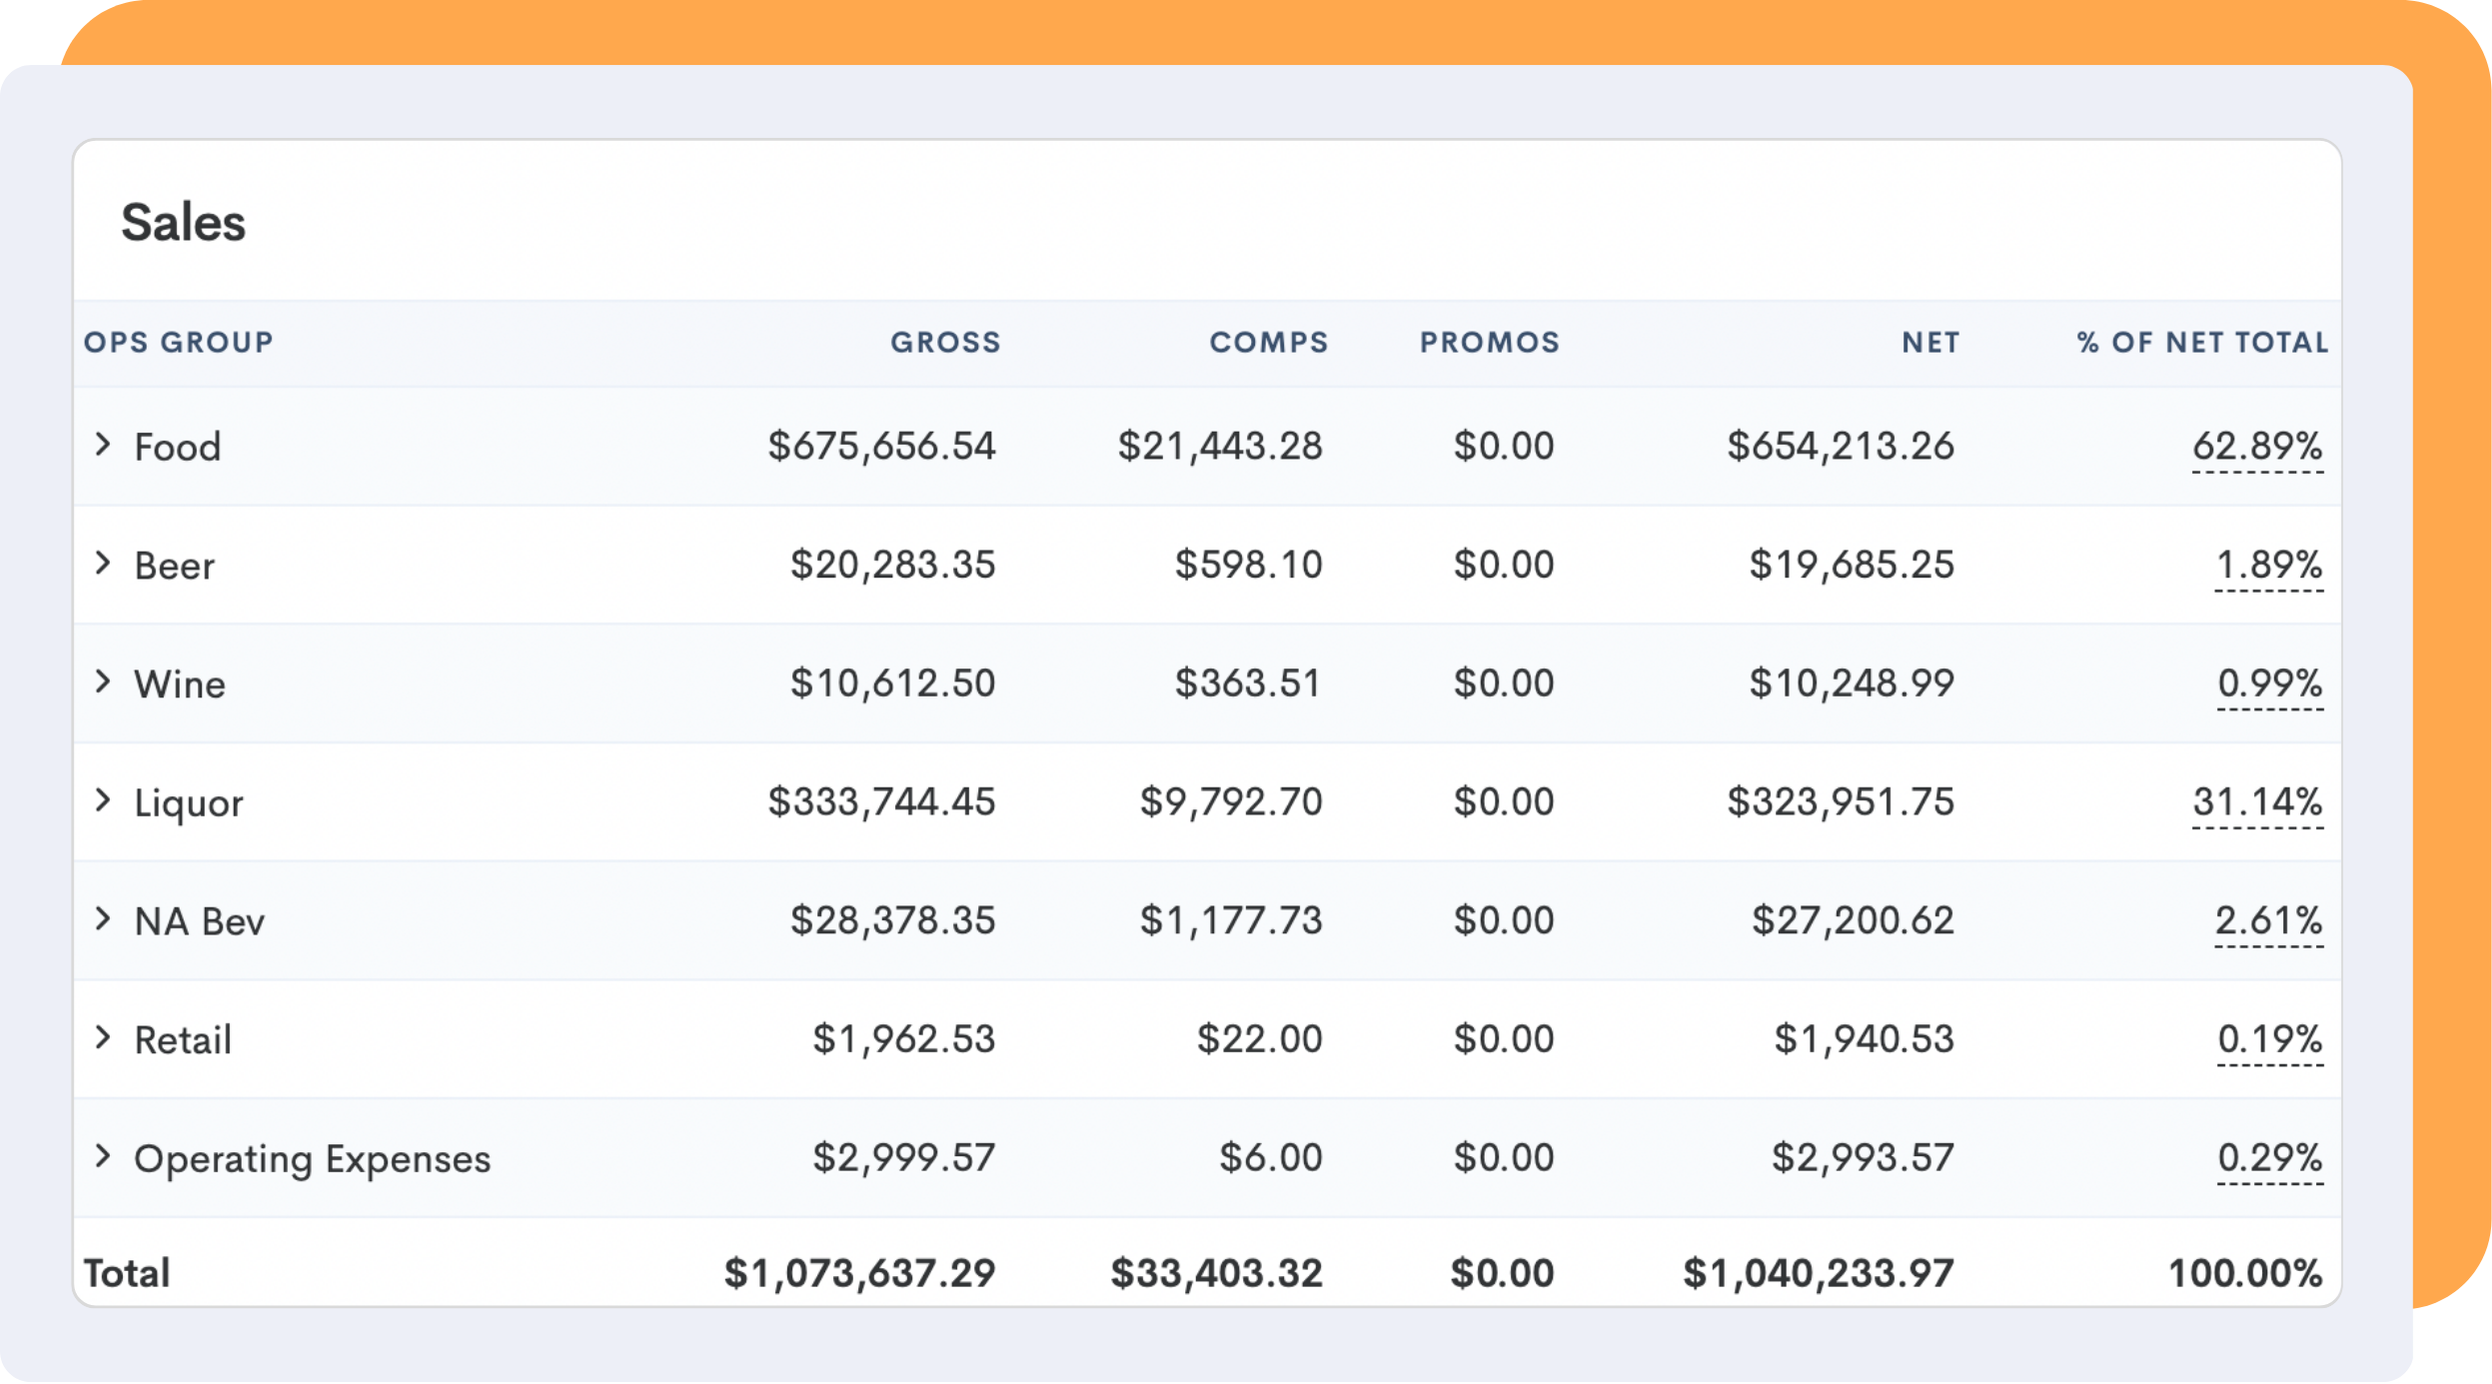
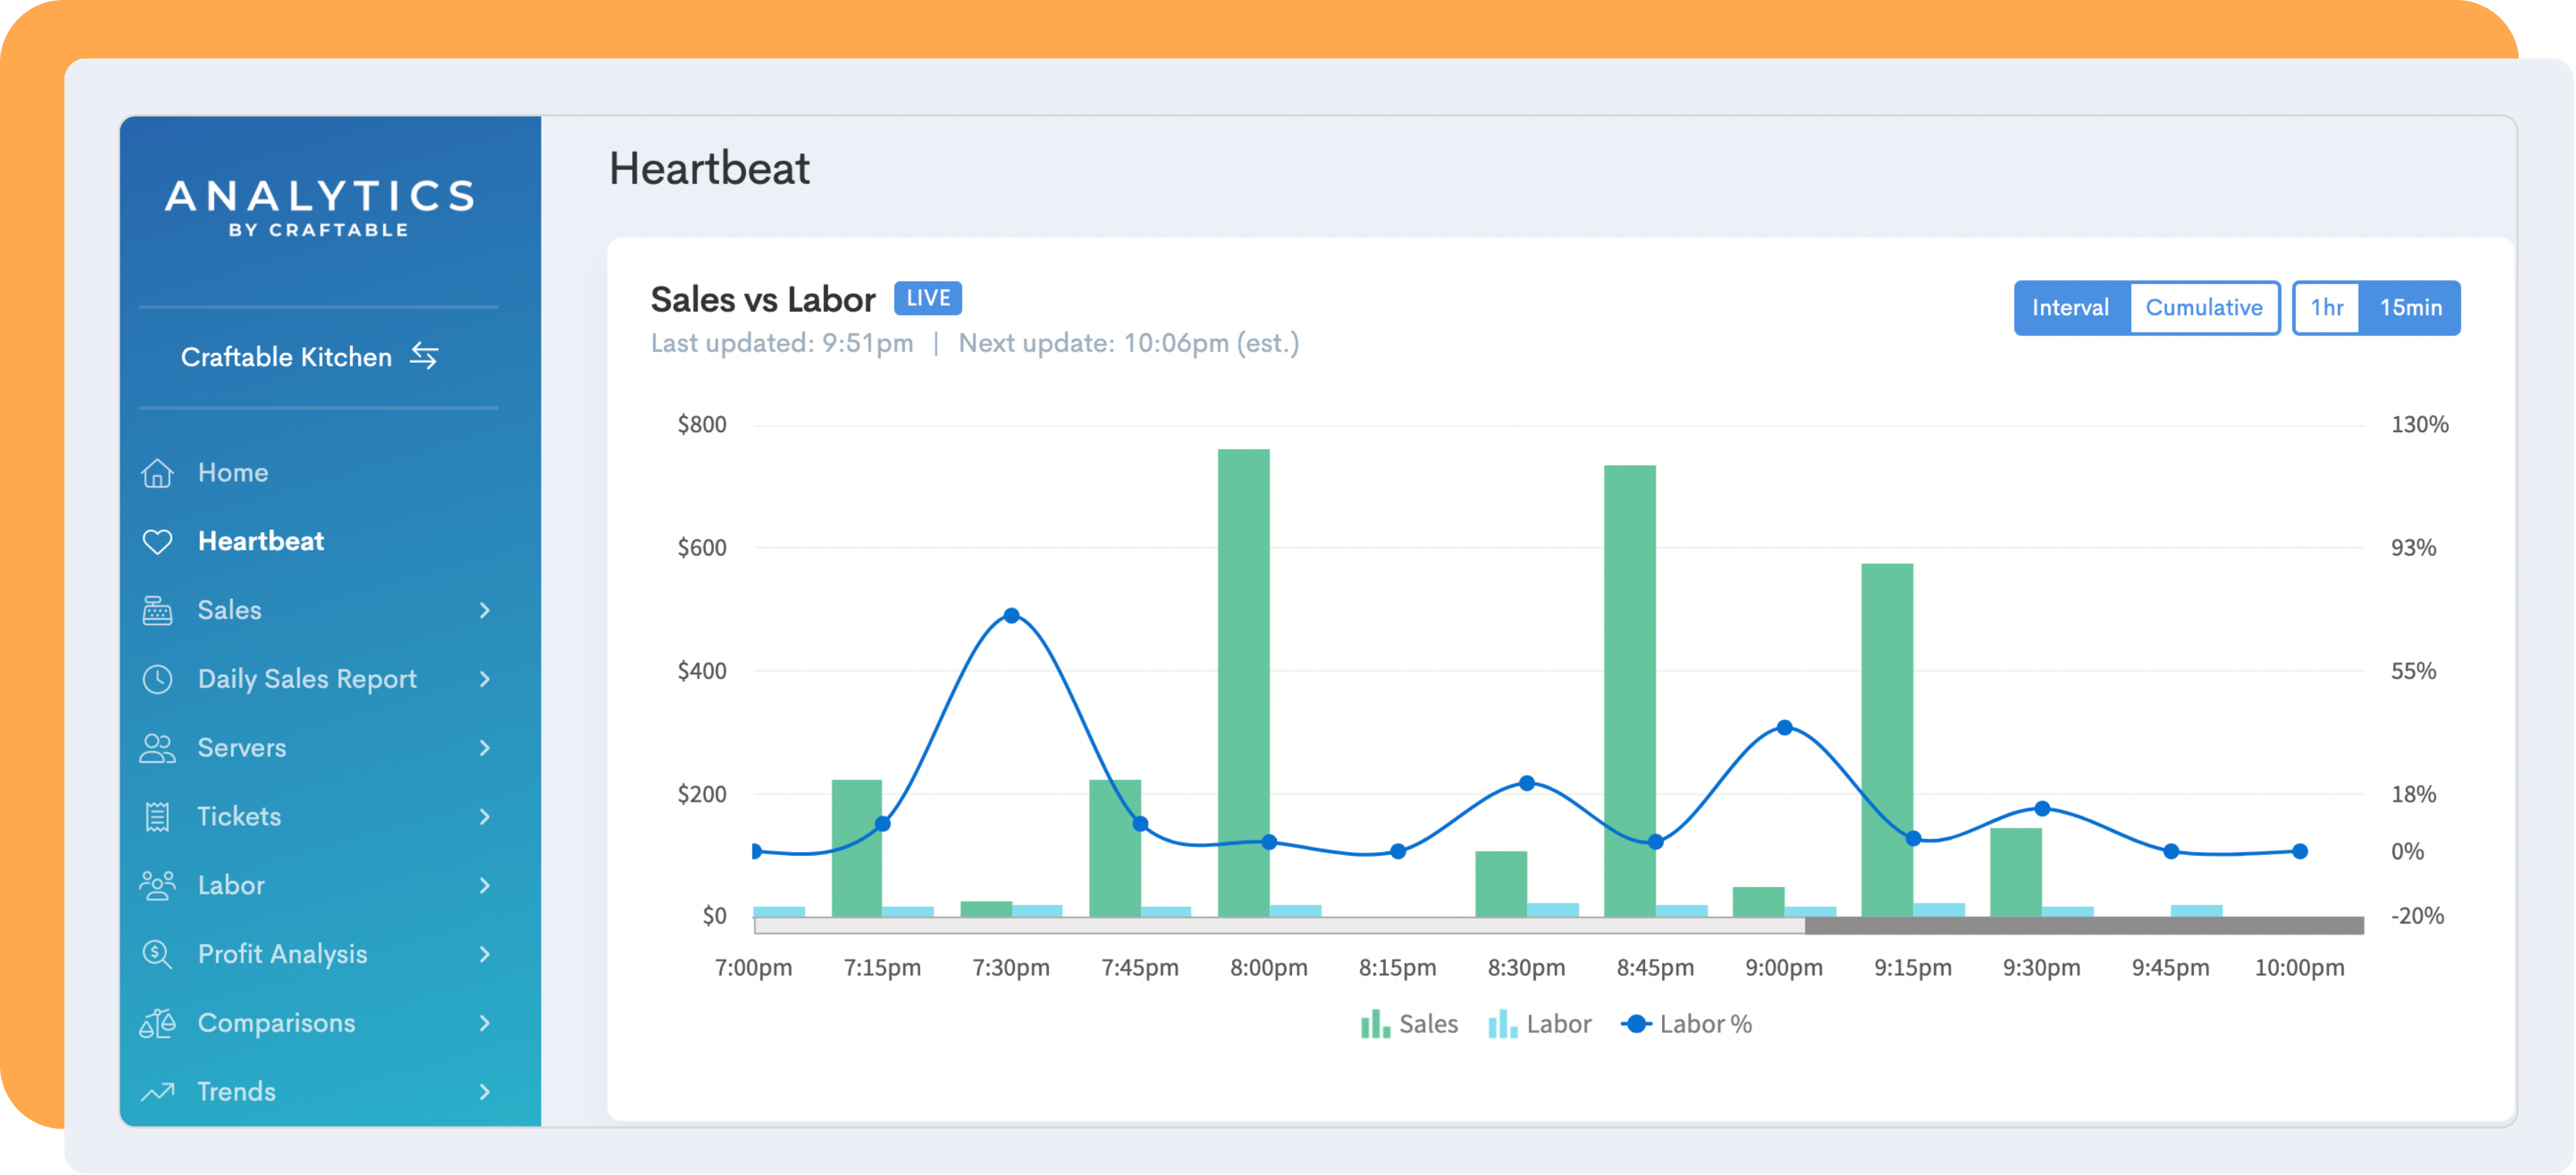
- Track live revenue and expenses by location
- Compare actual and theoretical COGS
- Break down variances by department or period
- Keep reporting consistent across teams and devices

See What’s Driving Cost
- Compare purchases to sales to spot mismatches
- Flag slow-moving or excess stock
- Link ingredients to menu items to understand profitability
- Catch pricing issues with PO-to-invoice matching

Reports That Run Themselves
Get the right insights to the right people, exactly when needed, and without any manual effort.
- Empower teams with real-time, role-specific dashboards
- Schedule reports by location, role, or metric
- Share audit-ready data with no extra work
- Gain clear insight into sales trends and cost drivers for smarter decisions.
.png)
.png)
.png)
.png)
.png)
.png)
.png)
.png)
.png)
.png)
.png)
.png)

Case Study
“We track data such as upselling, profit by employee, and server contests, all of which motivate our teams and provide metrics by which we are able to elevate our own in-house standards.”
30
labor hours saved monthly
80%
variance reduction
.png)